Cryptocurrency Weekly Market Cap Analysis and Forecast: Issue #1

Author: Duane M. Tilden, P.Eng.

Report Period: April 19th to 23rd, 2018

Disclaimer: The author is an active trader in cryptocurrencies and may have variable holdings in some or all digital assets reviewed. Trading and investing in cryptocurrency markets is considered a high risk venture and requires analysis, due diligence and patience. No guarantees on outcomes are offered or implied, market performance may change due to unforeseen events which may alter market participation. The analysis and subsequent forecast are “best guesses” or opinions based on information reviewed and methodology of examination and therefore may be subject to change.

Foreword

At this time I am planning to issue a weekly report and analysis. The reader is encouraged to read the analysis and familiarize themselves with terminology, cryptocurrencies and markets. Links, where deemed necessary will be included for reference and clarity. 

Purpose

The purpose of this ongoing blog is to develop and examine data in a scientific and methodical manner using a variety of tools to understand the movement of capital and price fluctuations in the cryptocurrency market. The cryptocurrency market is well known to be subject to volatility and can move quickly. To maximize profits a trader needs to have information into market movements which can be verified by various means of inquiry.

We will discuss these changes and explore the underlying causes. Forecasts made are our hypothesis or “best guess” and will be the basis of a Trading Plan.  Changes in holdings or planned capital investments may be made to adjust holdings to the forecast.  After the week we can review the results to determine how accurate our model and forecasts have been, and any required refinements.

Empowered with these tools it is hoped that those desiring to trade in these markets will be able to better evaluate portfolios and individual holdings to make buy, sell and/or hold decisions.

Weekly Analysis of Market

A. Total Market Cap

Using the tools we have developed to date let us continue with analyzing the cryptocurrency trading market using data from the past week. We seek to establish trends and using this information to forecast probable outcomes in the week ahead. To start lets take a look at the Total Market Cap (TMC) for the past week to spot the trends and chart data for further analysis. Total Crypto Market Cap April 16 to 23 2018

Total Crypto Market Cap April 16 to 23 2018 #2

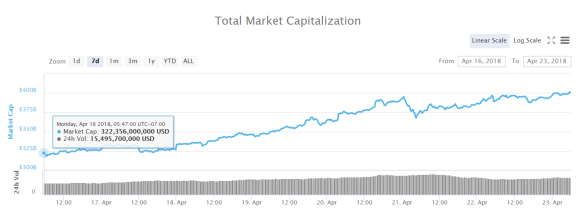
Figure 1: Cryptocurrency TMC Weekly Graph of April 16 to 23rd, 2018

We can see that the overall trend for the week has been steadily increasing with a short dip on April 21st. TMC increased by $78 Billion from $322 to $400 bn for a weekly increase of 24.2%. Daily volume has increased by $7bn from $15.5 to $22.5 bn for a 45% gain over the week.Total Crypto Market Cap Mar 23 to Apr 23 2018 #1.png

Figure 2: Cryptocurrency TMC 30 Day Graph – March 23 to April 23rd, 2018

This is continuing the reported upward trend from last that started on Monday April 9th where TMC was above $250 bn moving to April 12th where TMC started at $275 bn and rose by $25 bn in under one hour to $300 Billion. Daily volume peaked on April 13th to over $27 Billion traded in 24 hours. The two week change in TMC is $150 bn from $250 to $400 bn, for a 60% gain with an average rate of increase $10.7 bn/day or 7.13%.

B. Analysis of the Top 25 Cryptocurrencies by Market Cap and Price

TMC Top 25 Cryptocurrencies April 19 to 23 2018

Figure 3: TMC and Dominance of Top 25 Cryptocurrencies; April 19 to 23rd, 2018

A spreadsheet has been created to examine a variety of components of market capitalization, pricing and dominance and their variance over time. Where there are significant changes from the norm we can look for reasons to understand individual price changes and capital movement.

C. Variation in Dominance as a Predictive Indicator

The use of a dominance factor gives us an indication of the overall contribution to the TMC of an individual cryptocurrency coin or token. When this factor changes significantly over a measured period of time we may observe movements in price or MC which stand out from the overall market average.

From the period examined we have the following predictions for the upcoming week based on variance on dominance. Dominance indicates a current established trend in buying or selling. Where dominance is high and positive then for a fixed supply MC and Price will rise, and when high and negative the converse is true, that the cryptocurrency MC and Price are in a decline in value.

Caution is the word; not all declines in dominance are bad nor increases necessarily good. Sometimes when a market has moved too far in one direction a market correction may be in order and short term changes in dominance may indicate a correction. Increases in dominance should be examined for underlying cause for the cryptocurrency to gain popularity in the market.

Be aware, there are pump and dump schemes which can run up values in MC and Price for a short term while the architects of these manipulation activities profit. Generally speaking the organizers target obscure coins and tokens held on certain exchanges. Due to size and wide distribution the top 25 cryptocurrencies are considered safer from influence and price manipulation, although not immune.

In future articles I plan on performing more detailed examination of results and expand predictions or forecasts to include possible future outcomes as well as explore underlying causes to individual price movements.

Recommendations:

Top pick for the week is Bitcoin Cash.

Top 5: Buy or Hold

  1. Bitcoin Cash variance in dominance increased by 28.30 %
  2. IOTA variance in dominance increased by 7.94 %
  3. Monero variance in dominance increased by 5.51 %
  4. Ripple variance in dominance increased by 5.08 %
  5. Bitcoin Gold variance in dominance increased by 4.83 %

Bottom 5: Sell or Hold

  1.  Qtum variance in dominance decreased by -13.24 %
  2.  Tether variance in dominance decreased by -11.27 %
  3.  OmiseGo variance in dominance decreased by -10.96 %
  4.  Stellar variance in dominance decreased by -8.90 %
  5.  NEO variance in dominance decreased by -8.14 %


Advertisement

Chinese Blockbuster “Alibaba” Launches Cryptocurrency Mining Platform

[…When asked his feelings on digital currency, Ma claimed to be “totally confused,” explaining that “even if it works, the whole international rules on trade and financing are going to be completely changed.”

At the same time, Ma – whose net worth tops $46 billion – was quick to praise the advent of blockchain technology, suggesting his company had already looked into ways to harness this tool. …] (1)

Alibaba Group Holding Limited

(Chinese: 阿里巴巴集团控股有限公司; pinyin: Ālǐbābā Jítuán Kònggǔ Yǒuxiàn Gōngsī) is a Chinese multinational  e-commerce , retail, Internet and technology conglomerate founded in 1999 that provides consumer-to-consumer, business-to-consumer and business-to-business sales services via web portals, as well as electronic payment services, shopping search engines and data-centric cloud computing services. It also owns and operates a diverse array of businesses around the world in numerous sectors.[2]

In 2012, two of Alibaba’s portals handled 1.1 trillion yuan ($170 billion) in sales.[3] At closing time on the date of its initial public offering (IPO), 19 September 2014, Alibaba’s market value was US$231 billion.[4]

As of January 2018, Alibaba’s market cap stood at US$490 billion.[5] It is one of the top 10 most valuable and biggest companies in the world.[6]

References:

  1. alibaba-launching-crypto-platform
  2. Alibaba_Group – Wikipedia

Life-Cycle Cost Analysis (LCCA) | Whole Building Design Guide

Life-cycle cost analysis (LCCA) is a method for assessing the total cost of facility ownership. It takes into account all costs of acquiring, owning, and disposing of a building or building system. LCCA is especially useful when project alternatives that fulfill the same performance requirements, but differ with respect to initial costs and operating costs, have to be compared in order to select the one that maximizes net savings.

Source: www.wbdg.org

DESCRIPTION

A. Life-Cycle Cost Analysis (LCCA) Method

The purpose of an LCCA is to estimate the overall costs of project alternatives and to select the design that ensures the facility will provide the lowest overall cost of ownership consistent with its quality and function. The LCCA should be performed early in the design process while there is still a chance to refine the design to ensure a reduction in life-cycle costs (LCC).

The first and most challenging task of an LCCA, or any economic evaluation method, is to determine the economic effects of alternative designs of buildings and building systems and to quantify these effects and express them in dollar amounts.

lcca_2

Viewed over a 30 year period, initial building costs account for approximately just 2% of the total, while operations and maintenance costs equal 6%, and personnel costs equal 92%.
Graphic: Sieglinde Fuller
Source: Sustainable Building Technical Manual / Joseph J. Romm,Lean and Clean Management, 1994.

B. Costs

There are numerous costs associated with acquiring, operating, maintaining, and disposing of a building or building system. Building-related costs usually fall into the following categories:lcca_5

Initial Costs—Purchase, Acquisition, Construction Costs

Fuel Costs,

Operation, Maintenance, and Repair Costs

Replacement Costs; Residual Values—Resale or Salvage Values or Disposal Costs, Finance Charges—Loan Interest Payments

Non-Monetary Benefits or Costs

Only those costs within each category that are relevant to the decision and significant in amount are needed to make a valid investment decision. Costs are relevant when they are different for one alternative compared with another; costs are significant when they are large enough to make a credible difference in the LCC of a project alternative. All costs are entered as base-year amounts in today’s dollars; the LCCA method escalates all amounts to their future year of occurrence and discounts them back to the base date to convert them to present values. […]

Energy and Water Costs

Operational expenses for energy, water, and other utilities are based on consumption, current rates, and price projections. Because energy, and to some extent water consumption, and building configuration and building envelope are interdependent, energy and water costs are usually assessed for the building as a whole rather than for individual building systems or components.

Energy usage: Energy costs are often difficult to predict accurately in the design phase of a project. Assumptions must be made about use profiles, occupancy rates, and schedules, all of which impact energy consumption. At the initial design stage, data on the amount of energy consumption for a building can come from engineering analysis or from a computer program such as eQuest.ENERGY PLUS (DOE), DOE-2.1E and BLAST require more detailed input not usually available until later in the design process. Other software packages, such as the proprietary programs TRACE (Trane), ESPRE (EPRI), and HAP (Carrier) have been developed to assist in mechanical equipment selection and sizing and are often distributed by manufacturers.

When selecting a program, it is important to consider whether you need annual, monthly, or hourly energy consumption figures and whether the program adequately tracks savings in energy consumption when design changes or different efficiency levels are simulated.  […]

Operation, Maintenance, and Repair Costs

(Courtesy of Washington State Department of General Administration)

Non-fuel operating costs, and maintenance and repair (OM&R) costs are often more difficult to estimate than other building expenditures. Operating schedules and standards of maintenance vary from building to building; there is great variation in these costs even for buildings of the same type and age. It is therefore especially important to use engineering judgment when estimating these costs.

Supplier quotes and published estimating guides sometimes provide information on maintenance and repair costs. Some of the data estimation guides derive cost data from statistical relationships of historical data (Means, BOMA) and report, for example, average owning and operating costs per square foot, by age of building, geographic location, number of stories, and number of square feet in the building. The Whitestone Research Facility Maintenance and Repair Cost Reference gives annualized costs for building systems and elements as well as service life estimates for specific building components. The U.S. Army Corps of Engineers, Huntsville Division, provides access to a customized OM&R database for military construction (contact: Terry.L.Patton@HND01.usace.army.mil).

Replacement Costs

The number and timing of capital replacements of building systems depend on the estimated life of the system and the length of the study period. Use the same sources that provide cost estimates for initial investments to obtain estimates of replacement costs and expected useful lives. A good starting point for estimating future replacement costs is to use their cost as of the base date. The LCCA method will escalate base-year amounts to their future time of occurrence.

Residual Values

The residual value of a system (or component) is its remaining value at the end of the study period, or at the time it is replaced during the study period. Residual values can be based on value in place, resale value, salvage value, or scrap value, net of any selling, conversion, or disposal costs. As a rule of thumb, the residual value of a system with remaining useful life in place can be calculated by linearly prorating its initial costs. For example, for a system with an expected useful life of 15 years, which was installed 5 years before the end of the study period, the residual value would be approximately 2/3 (=(15-10)/15) of its initial cost.

Other Costs

Finance charges and taxes: For federal projects, finance charges are usually not relevant. Finance charges and other payments apply, however, if a project is financed through an Energy Savings Performance Contract (ESPC) or Utility Energy Services Contract (UESC). The finance charges are usually included in the contract payments negotiated with the Energy Service Company (ESCO) or the utility.

Non-monetary benefits or costs: Non-monetary benefits or costs are project-related effects for which there is no objective way of assigning a dollar value. Examples of non-monetary effects may be the benefit derived from a particularly quiet HVAC system or from an expected, but hard-to-quantify productivity gain due to improved lighting. By their nature, these effects are external to the LCCA, but if they are significant they should be considered in the final investment decision and included in the project documentation. See Cost-Effective—Consider Non-Monetary Benefits.

To formalize the inclusion of non-monetary costs or benefits in your decision making, you can use the analytical hierarchy process (AHP), which is one of a set of multi-attribute decision analysis (MADA) methods that consider non-monetary attributes (qualitative and quantitative) in addition to common economic evaluation measures when evaluating project alternatives. ASTM E 1765 Standard Practice for Applying Analytical Hierarchy Process (AHP) to Multi-attribute Decision Analysis of Investments Related to Buildings and Building Systems published by ASTM International presents a procedure for calculating and interpreting AHP scores of a project’s total overall desirability when making building-related capital investment decisions. A source of information for estimating productivity costs, for example, is the WBDG Productive Branch.  [….]

D. Life-Cycle Cost Calculation

After identifying all costs by year and amount and discounting them to present value, they are added to arrive at total life-cycle costs for each alternative:

LCC =  I + Repl — Res + E + W + OM&R + O

LCC = Total LCC in present-value (PV) dollars of a given alternative
I = PV investment costs (if incurred at base date, they need not be discounted)
Repl = PV capital replacement costs
Res = PV residual value (resale value, salvage value) less disposal costs
E = PV of energy costs
W = PV of water costs
OM&R = PV of non-fuel operating, maintenance and repair costs
O = PV of other costs (e.g., contract costs for ESPCs or UESCs)

E. Supplementary Measures

Supplementary measures of economic evaluation are Net Savings (NS), Savings-to-Investment Ratio (SIR), Adjusted Internal Rate of Return (AIRR), and Simple Payback (SPB) or Discounted Payback (DPB). They are sometimes needed to meet specific regulatory requirements. For example, the FEMP LCC rules (10 CFR 436A) require the use of either the SIR or AIRR for ranking independent projects competing for limited funding. Some federal programs require a Payback Period to be computed as a screening measure in project evaluation. NS, SIR, and AIRR are consistent with the lowest LCC of an alternative if computed and applied correctly, with the same time-adjusted input values and assumptions. Payback measures, either SPB or DPB, are only consistent with LCCA if they are calculated over the entire study period, not only for the years of the payback period.

All supplementary measures are relative measures, i.e., they are computed for an alternative relative to a base case.  […]”<

See on Scoop.itGreen Building Design – Architecture & Engineering

Leaked HSBC Files from Swiss Bank lead to Tax Evasion and Money Laundering charges

Data in massive cache of leaked secret bank account files lift lid on questionable practices at subsidiary of one of world’s biggest financial institutions

Source: www.theguardian.com

Video:  Guardian explains case against HSBC

>”[…]  The Guardian’s evidence of a pattern of misconduct at HSBC in Switzerland is supported by the outcome of recent court cases in the US and Europe. The bank was named in the US as a co-conspirator for handing over “bricks” of $100,000 a time to American surgeon Andrew Silva in Geneva, so that he could illegally post cash back to the US.

Another US client, Sanjay Sethi, pleaded guilty in 2013 to cheating the US tax authorities. He was one of a group of convicted HSBC clients. The prosecution said an HSBC banker promised “the undeclared account would allow [his] assets to grow tax-free, and bank secrecy laws in Switzerland would allow Sethi to conceal the existence of the account”.

In France, an HSBC manager, Nessim el-Maleh, was able to run a cash pipeline in which plastic bags full of currency from the sale of marijuana to immigrants in the Paris suburbs were collected. The cash was then taken round to HSBC’s respectable clients in the French capital. Bank accounts back in Switzerland were manipulated to reimburse the drug dealers.

HSBC is already facing criminal investigations and charges in France, Belgium, the US and Argentina as a result of the leak of the files, but no legal action has been taken against it in Britain.

Former tax inspector Richard Brooks tells BBC Panorama in a programme to be aired on Monday night: “I think they were a tax avoidance and tax evasion service. I think that’s what they were offering.

“There are very few reasons to have an offshore bank account, apart from just saving tax. There are some people who can use an … account to avoid tax legally. For others it’s just a way to keep money secret.”

The Labour party said: “Tax avoidance and evasion harms every taxpayer in Britain, and undermines public services like the NHS. What is truly shocking is that HMRC were made fully aware of these practices back in 2010 but since then very little has been done.””<

See on Scoop.itSocial Media, Crypto-Currency, Security & Finance

The Oil Crash Sours LNG Future, Project Put on Hold

The floating 8 million tonne per annum (mtpa) export plant moored at Lavaca Bay, Texas advanced by Houston-based Excelerate has been put on hold, according to regulatory filings obtained by Reuters.

Source: www.businessinsider.com

>” […] The project was initially due to begin exports in 2018.

Excelerate’s move bodes ill for thirteen other U.S. LNG projects, which have also not signed up enough international buyers, to reach a final investment decision (FID). Only Cheniere’s Sabine Pass and Sempra’s Cameron LNG projects have hit that milestone.

Back when LNG and crude oil prices were riding high in February, Excelerate, founded by Oklahoma billionaire George Kaiser, applied for permits to build the facility.

Eleven months on, its submission to the U.S. Federal Energy Regulatory Commission on Dec. 23 said that uncertainty generated by a steep decrease in oil prices has forced it to conduct a “strategic reconsideration of the economic value of the project” and to suspend all activities until April 1, 2015.

“Due to the recent global market conditions, the company has determined that, at this time, this project no longer meets the financial criteria necessary in order for us to move forward with the capital investment,” a company spokesman told Reuters.

Stiff economic headwinds are making new developments tough going.

Prices that LNG projects can charge for long-term supply are falling from historic highs as new producers crowd the market, which is already oversupplied due to slowing demand and rising output that has seen spot Asian LNG prices halve this year.

At the same time, major consumers from Japan to South Korea and China are seeking to offload some of their long-term LNG supply commitments, contributing to the glut. […]”<

Read more: http://www.businessinsider.com/r-exclusive-oil-price-crash-claims-first-us-lng-project-casualty-2014-12#ixzz3NVGgV68I

See on Scoop.itGreen & Sustainable News

$200m Demand Management Program Approved in NYC to Defer $1 billion SubStation to 2026

The NYPSC approved Con Ed of New York’s proposed $200 million Brooklyn/Queens Demand Management Program that would relieve overloads in the city.

Source: www.rtoinsider.com

>” […] Con Ed’s proposed Brooklyn/Queens Demand Management Program is consistent with the state’s “Reforming the Energy Vision” program to restructure the electricity market with greater reliance on technology and distributed resources, the commission said. “The commission is making a significant step forward toward a regulatory paradigm where utilities incorporate alternatives to traditional infrastructure investment when considering how to meet their planning and reliability needs,” the order states.

Commission Chair Audrey Zibelman added that because of the recent D.C. Circuit Court of Appeals decision striking down federal jurisdiction over demand response in wholesale markets, it’s important for state regulators to set market rules for that resource.

Con Ed said the feeders serving the Brownsville No. 1 and 2 substations began to experience overloads in 2013 and would be overloaded by 69 MW for 40 to 48 hours during the summer by 2018. A new substation, transmission subfeeders and a switching station would cost $1 billion, according to the company. The PSC accepted the company’s estimate of the DM Program’s costs and ordered a cap of $200 million.

The program would include 52 MW of non-traditional utility-side and customer-side relief, including about 41 MW of energy efficiency, demand management and distributed generation, and 11 MW of utility-side battery energy storage. This will include incentives to upgrade building “envelopes,” improve air conditioning efficiency of equipment, encourage greater use of energy controls, and establish energy storage, distributed generation or microgrids.

This will be supplemented by approximately 17 MW of traditional utility infrastructure investment, consisting of 6 MW of capacitors and 11 MW of load transfers from the affected area to other networks.  […]”<


See on Scoop.itGreen Energy Technologies & Development

Built in 1928 Chicago Apartment Building Energy Retrofit Achieves EPA Energy Star Certification

To say the 55-unit building in Chicago’s South Shore neighborhood was in disarray when it was changing hands in 2009 would be an understatement.

Source: www.chicagotribune.com

>” […] the building is among the first in the Midwest — and only three in Chicago — to achieve the Environmental Protection Agency’s new Energy Star certification for multifamily buildings. Also receiving the designation were two condominium buildings in Chicago, 680 N. Lake Shore Drive and River City, at 800 S. Wells.

[…] Jeffery Parkway also stands as an example of how an older, smaller, affordable apartment building can be made more comfortable for its tenants while saving its owner cash in the long run.

Seeking a neutral third party to help them figure out the entire scope of a rehab project, the Soods obtained a free energy audit of the building and its systems from Elevate Energy, a Chicago-based nonprofit that works with consumers and businesses to improve energy efficiency.

Elevate looks at historical analyses of a building’s energy use and compares it with similar buildings in terms of age and size. Then it performs an on-site performance assessment of the existing heating, cooling and lighting systems and makes recommendations for potential improvements. […]

“The average cost of a retrofit is about $2,500 to $3,000 a unit,” Ludwig said. “We’re not talking about huge-ticket items. A lot of times we are trying to identify the most cost-effective retrofit measures, how can we tighten the building envelope. It doesn’t have to mean a new boiler is going in the basement.”

However, in the case of Jeffery Parkway, it did mean a new steam boiler and new water heaters, among other upgrades.

The project was financially feasible because of a loan from nonprofit Community Investment Corp.’s Energy Savers loan program, which offers a seven-year loan with a 3 percent fixed interest rate for qualified upgrades made to buildings in the seven-county Chicago area and Rockford. […]

“We will cover any of the recommendations that show up in the energy assessment, and we’ll also do other energy-related improvements,” said Jim Wheaton, manager of the Energy Savers program. “This is not a program designed for the North Lake Shore Drive high-rise. It’s designed for buildings affordable for working folks.”

Multifamily buildings receive an Energy Star score of 1 to 100, and those that score above 75 can apply for the certification. Nautilus’ building received a score of 99.

“The savings are tremendous,” Sandeep Sood said. “We were facing, just on the gas bill, a $60,000 bill a year. As of last year, our bill was $18,000. It was an unbelievable savings.” […]”<

See on Scoop.itGreen Building Operations – Systems & Controls, Maintenance & Commissioning

The financial case for energy efficiency

“The report, Building the Future, has piled pressure on Ministers to act to fix Britain’s badly insulated homes. The report shows that a much more ambitious energy efficiency investment programme would pay for itself and significantly boost the UK economy.

The programme would add £13.9 billion annually to the UK economy by 2030, with GDP boosted by £3.20 for every £1 invested by the Government. A national scheme to make homes super-energy efficient would result in £8.6 billion in energy savings per year by 2030, an average energy saving of £372 per household. After taking into account loan repayments this would result in £4.95 billion in financial savings per year for Britain’s households.”

Grid Parity Is Accelerating the US Solar Revolution

“Solar PV installations in the U.S. increased an impressive 485% from 2010 to 2013, and by early 2014, there were more than 480,000 systems in the country. That’s 13,400 MW, enough to power about 2.4 million typical American homes.”


Source: www.pvsolarreport.com

>” […] You can definitely see a correlation between electricity price and amount of solar installed, though there are exceptions. Kansas, for example, has fairly high grid prices but little solar — a testament to the fact that good policy is also a key ingredient in promoting solar. And Alaska is not exactly highly populated. For the most part, though, solar is flourishing in states with high electricity rates.

In some states like California, already one of the most expensive places for electricity in the country, residential rates will soon be going up further. Customers in the PG&E service area are looking at a 3.8% increase in electricity bills. Overall, electricity prices in the U.S. have been rising rapidly. According to the Energy Information Administration, in the first half of 2014, U.S. retail residential electricity prices went up 3.2% from the same period last year — the highest year-over-year growth since 2009. […]

The fact is, solar and other renewables just keep getting cheaper. We’ve noticed a number of stories debating this recently, many in reaction to an Economist article on how expensive wind and solar really are. But as Amory Lovins points out, the reality is that renewables are getting cheaper all the time, regardless of anyone’s arguments.

What does this mean? It means that grid parity is coming sooner than you might think […]”<

See on Scoop.itGreen Energy Technologies & Development

Solar Energy Storage Added to Eight California Schools

Burton School District, in the heart of California’s sun-drenched San Joaquin Valley, will also house combined solar and energy storage systems[…]

Source: www.pvsolarreport.com

>”In the commercial sector, the cost of energy storage is now low enough that businesses are finding it a useful addition to solar. Generally, businesses’ peak energy consumption is when electricity is most expensive, which makes energy storage especially useful.

As the cost of energy storage continues to decline, large solar companies have been integrating it into their product offerings to complement a solar system. […]

The district will install solar and DemandLogic to generate and store its own clean, renewable electricity at eight schools. This will be the largest combined solar and energy storage installation SolarCity has undertaken to date. It will allow the district schools to reduce energy costs by using stored electricity to lower peak demand.

SolarCity will install the district’s solar systems and battery storage at eight elementary and middle schools, as well as additional solar generation at a district office. The solar installations will total more than 1.4 MW of capacity, with storage providing an additional 360 kW (720 kWh) of power to reduce peak demand. The new solar systems are expected to save the district more than $1 million over the life of the contracts, and the DemandLogic battery storage systems could save thousands more on demand charges each year.

[…]

The new SolarCity systems are expected to generate 2,300 MWh of solar energy annually, and enough over the life of the contract to power more than 4,000 homes for a year. The solar systems will also offset over 43 million pounds of carbon dioxide and save more than 203 million gallons of water, an especially important environmental benefit in the drought-stricken valley. The entire storage project is expected to be completed by May 2015.”<

See on Scoop.itGreen Energy Technologies & Development