Cryptocurrency Weekly Market Cap Analysis and Forecast: Issue #1

Author: Duane M. Tilden, P.Eng.

Report Period: April 19th to 23rd, 2018

Disclaimer: The author is an active trader in cryptocurrencies and may have variable holdings in some or all digital assets reviewed. Trading and investing in cryptocurrency markets is considered a high risk venture and requires analysis, due diligence and patience. No guarantees on outcomes are offered or implied, market performance may change due to unforeseen events which may alter market participation. The analysis and subsequent forecast are “best guesses” or opinions based on information reviewed and methodology of examination and therefore may be subject to change.

Foreword

At this time I am planning to issue a weekly report and analysis. The reader is encouraged to read the analysis and familiarize themselves with terminology, cryptocurrencies and markets. Links, where deemed necessary will be included for reference and clarity. 

Purpose

The purpose of this ongoing blog is to develop and examine data in a scientific and methodical manner using a variety of tools to understand the movement of capital and price fluctuations in the cryptocurrency market. The cryptocurrency market is well known to be subject to volatility and can move quickly. To maximize profits a trader needs to have information into market movements which can be verified by various means of inquiry.

We will discuss these changes and explore the underlying causes. Forecasts made are our hypothesis or “best guess” and will be the basis of a Trading Plan.  Changes in holdings or planned capital investments may be made to adjust holdings to the forecast.  After the week we can review the results to determine how accurate our model and forecasts have been, and any required refinements.

Empowered with these tools it is hoped that those desiring to trade in these markets will be able to better evaluate portfolios and individual holdings to make buy, sell and/or hold decisions.

Weekly Analysis of Market

A. Total Market Cap

Using the tools we have developed to date let us continue with analyzing the cryptocurrency trading market using data from the past week. We seek to establish trends and using this information to forecast probable outcomes in the week ahead. To start lets take a look at the Total Market Cap (TMC) for the past week to spot the trends and chart data for further analysis. Total Crypto Market Cap April 16 to 23 2018

Total Crypto Market Cap April 16 to 23 2018 #2

Figure 1: Cryptocurrency TMC Weekly Graph of April 16 to 23rd, 2018

We can see that the overall trend for the week has been steadily increasing with a short dip on April 21st. TMC increased by $78 Billion from $322 to $400 bn for a weekly increase of 24.2%. Daily volume has increased by $7bn from $15.5 to $22.5 bn for a 45% gain over the week.Total Crypto Market Cap Mar 23 to Apr 23 2018 #1.png

Figure 2: Cryptocurrency TMC 30 Day Graph – March 23 to April 23rd, 2018

This is continuing the reported upward trend from last that started on Monday April 9th where TMC was above $250 bn moving to April 12th where TMC started at $275 bn and rose by $25 bn in under one hour to $300 Billion. Daily volume peaked on April 13th to over $27 Billion traded in 24 hours. The two week change in TMC is $150 bn from $250 to $400 bn, for a 60% gain with an average rate of increase $10.7 bn/day or 7.13%.

B. Analysis of the Top 25 Cryptocurrencies by Market Cap and Price

TMC Top 25 Cryptocurrencies April 19 to 23 2018

Figure 3: TMC and Dominance of Top 25 Cryptocurrencies; April 19 to 23rd, 2018

A spreadsheet has been created to examine a variety of components of market capitalization, pricing and dominance and their variance over time. Where there are significant changes from the norm we can look for reasons to understand individual price changes and capital movement.

C. Variation in Dominance as a Predictive Indicator

The use of a dominance factor gives us an indication of the overall contribution to the TMC of an individual cryptocurrency coin or token. When this factor changes significantly over a measured period of time we may observe movements in price or MC which stand out from the overall market average.

From the period examined we have the following predictions for the upcoming week based on variance on dominance. Dominance indicates a current established trend in buying or selling. Where dominance is high and positive then for a fixed supply MC and Price will rise, and when high and negative the converse is true, that the cryptocurrency MC and Price are in a decline in value.

Caution is the word; not all declines in dominance are bad nor increases necessarily good. Sometimes when a market has moved too far in one direction a market correction may be in order and short term changes in dominance may indicate a correction. Increases in dominance should be examined for underlying cause for the cryptocurrency to gain popularity in the market.

Be aware, there are pump and dump schemes which can run up values in MC and Price for a short term while the architects of these manipulation activities profit. Generally speaking the organizers target obscure coins and tokens held on certain exchanges. Due to size and wide distribution the top 25 cryptocurrencies are considered safer from influence and price manipulation, although not immune.

In future articles I plan on performing more detailed examination of results and expand predictions or forecasts to include possible future outcomes as well as explore underlying causes to individual price movements.

Recommendations:

Top pick for the week is Bitcoin Cash.

Top 5: Buy or Hold

  1. Bitcoin Cash variance in dominance increased by 28.30 %
  2. IOTA variance in dominance increased by 7.94 %
  3. Monero variance in dominance increased by 5.51 %
  4. Ripple variance in dominance increased by 5.08 %
  5. Bitcoin Gold variance in dominance increased by 4.83 %

Bottom 5: Sell or Hold

  1.  Qtum variance in dominance decreased by -13.24 %
  2.  Tether variance in dominance decreased by -11.27 %
  3.  OmiseGo variance in dominance decreased by -10.96 %
  4.  Stellar variance in dominance decreased by -8.90 %
  5.  NEO variance in dominance decreased by -8.14 %


Advertisement

Weekly Market Cap Surges $50 Billion; Cryptocurrency Prices Continue to Rise

Previously, I reported on Cryptocurrency Market Capitalization and its relevance to understanding movements in the prices of cryptocurrencies. Let’s take a look at the markets one week after the reported $25bn of capital was put into the crypto markets. Refer to Figures 1 and 2 below, where in Fig. 2 we see that the TMC moved from $275 bn to $300 bn in under one hour.

Total Crypto Market Cap April 12 to 19 2018

Figure 1. Total Market Capitalization April 12 to 19th, 2018


Total Crypto Market Cap April 5 to 12 2018

Figure 2. TMC April 5 to 12th, 2018 (1)

Inspection of Figure 1. indicates that the TMC demonstrates a weekly upward trend. After the initial spike of $25 bn reported last Thursday, another $25 bn was added to the TMC Friday. For most of the week it hovered at the $325 bn level until Wednesday April 18th. Since then another $25 bn has been added over 24 hours to a new level of $350 billion. This is a total increase in the TMC of the Cryptocurrency market in one week of $75 billiion, or 27.2 %, from $275 to $350 billion.

TMC Top 25 Cryptocurrencies April 19 2018Figure 3. TMC of Top 25 Cryptocurrencies, April 12th to 19th 

Top 25 Cryptocurrencies

Of the listed 1574 cryptocurrencies traded on over 10,000 markets as reported by the website CoinMarketCap we see that Bitcoin represents over 39% of the TMC, and the top 25 altogether account for over 87% of capital in the market.

Of the 25 listed coins/tokens inspected we see that 22 advanced and only 3 retracted on the week, for 88% of the listed cryptocurrencies in the green. Most of these advanced by 25 to 35% over the week, with Stellar advancing the most at 59%. This is an example of a competitive marketplace where various suppliers are in competition for market share.

Note that the TMC increased from $275 to $350 Billion USD or 27%, and by inspection we can see that the average price of the cryptocurrencies listed in the top 25 increased by a rate between 25 to 35%. At present the TMC of $350 bn is 42% of the peak TMC of $829 bn  which occurred earlier this year on January 7, 2018. Since the peak the TMC has been generally trending down to current levels.

We can see from the forgoing that there is a strong correlation between TMC and the price movements of the various cryptocurrencies. This is the market dynamic of supply and demand in action; as the money supply increases in a market of fixed supply such as cryptocurrency, the prices of said commodities in that market must rise.

Is it possible that we have seen the bottom range of current TMC and moving forward we may experience more uptrends.

Happy Trading!

References:

  1. understanding-cryptocurrency-trading-markets-and-total-market-capitalization/


Understanding Cryptocurrency Trading Markets and Total Market Capitalization

Note: Soon to come is a separate blog for Digital Assets where I will continue to write, curate and publish these types of articles, reports and reviews relating to the Digital Asset Class, FinTech, Blockchain, Smart Contracts, CryptoCurrency and Markets. Duane M. Tilden, P.Eng; April 12, 2018.

Foreword:

Working on technical analysis of cryptocurrency, such as Bitcoin, we search for causes and effects to understand what makes markets move or prices to change. This is quite similar to how we may view the stock or commodity markets and a lot can be gained from techniques used by stock analysts and traders. Knowing how much of a commodity one can purchase for a given price is often vital to budgeting, whether it’s for a construction project, a dinner, or some other financial endeavour. If I cannot purchase enough of one product for a particular price then I must either raise more capital, or purchase an inferior product that may meet the specification or recipe, if one is available that can achieve the desired outcome.

Observing trends on charts and graphs is part of the toolbox where changes in pricing, volume or other parameters are graphed over time. We search for short, medium and long term trends. When something happens in a marketplace we assume there is a reason and look for relationships so that we can further understand market influences on pricing. Down to a basic level we seek “if this, then that”. This is the basis of supply demand economics.

Thursday, April 12th 2018 we saw that the price of Bitcoin went from trading at about $6800 to $7800 USD overnight, an increase of about 15%. An excellent opportunity to investigate what is the cause of this change in price and subsequent effects in the cryptocurrency market. How does this event distinguish itself from other price changes we often read or hear about regarding Bitcoin? If you wish to know more, read on.

Market Cap and Total Market Capitalization

Prior to the advent of cryptocurrency markets Market Capitalization is used in the financial world to define the size of a company by multiplying the current stock price by the number of outstanding shares to determine the size of a company. Currently the usage of Market Capitalization and Total Market Capitalization are applied also to the issues of Cryptocurrencies such as Bitcoin, Ethereum, Litecoin, Ripple, Tron, Lisk, Minex, Dash, EOS and a multitude more. Every month new coins and tokens are emerging with whitepapers, websites, and ICO offerings.

Simply put, the Total Market Capitalization (TMC) is the sum of all the cryptocurrencies Market Caps (MC) listed and traded on the polled markets. It is important to remember this basic concept regarding markets in that there are events in the world which may cause change in attitudes or availability of capital, and movements of capital in or out of the market are reflected in the Total Market Cap. As this value moves so does money in and out of the markets.

Total Crypto Market Cap 2013 to April 12 2018

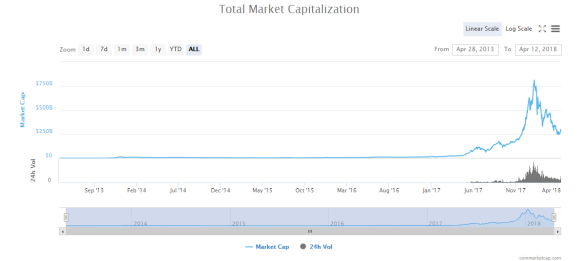
Figure 1. Total Market Capitalization of Listed Cryptocurrencies, April 28 2013 to April 12 2018

Total Crypto Market Cap April 5 to 12 2018

Figure 2. Total Market Capitalization of Listed Cryptocurrencies, April 5 2018 to April 12 2018

Bitcoin Price on Coinbase 4122018

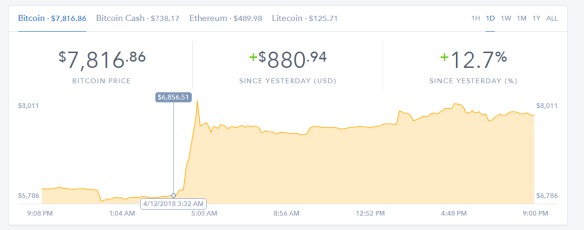
Figure 3. Bitcoin $1000 (15%) One Hour Price Increase on Coinbase on April 12th, 2018.

Examining the forgoing graph on Figure 1 we can see how most of the TMC has been raised in the last 12 months. The TMC peaked on Sunday, January 7th 2018 with a value of $813.87 billion, and has a current value (April 13th, 2018) of $301.79 billion. Note that when we examine Figure 2 and the weekly chart of TMC we see a decided jump in value from around $275 billion to the current $300 billion, indicating $25 billion was introduced into the cryptocurrency market in less than a day.

Dominance - Percentage of Total Crypto Market Cap April 2013 to 2018

Figure 4. Historical Dominance Chart – Percentage of TMC by Cryptocurrency 

In Figure 3, this influx of capital into the market was reflected in the rapid increase in the price of Bitcoin, which has the highest trade volume on all markets and is dominant in the cryptocurrency market as seen in Figure 4. Coinbase price for Bitcoin shot up from $6856 to $8011 in about one hour, marking a jump in value of $1155 or 16.8%.

Almost all other cryptocurrencies followed suit and prices increased across the board as the previously tight bear market flooded with new capital. Sell orders were triggered as the prices rose rapidly and traders had new capital to reinvest into the market, resulting in further increases in alt coin prices.

Markets and Events

So we have clear evidence that a surge or influx of capital has entered the market. Now the questions that remain in our analysis of this significant event or change in the market are threefold; 1. What happened?  2. Who is making the trades?  3. On what markets?

1. What Happened?

One potential cause for this change in TMC is the entrance of new money or players in the market. A study released on April 10th regarding the compliance of Bitcoin and cryptocurrencies meeting Islamic law relating to money and usury concluded by one Islamic scholar to be halal, or meeting strict Islamic requirements. For cryptocurrency holders this is important news as it opens markets to a significant sized population of potential users and investors.

JAKARTA, Indonesia. – April 10, 2018 – As fluctuations and volatility continue to rock the cryptocurrency world, Blossom Finance has commissioned and released a working paper exploring the Islamic permissibility of bitcoin, cryptocurrency, and blockchain. The paper concludes that Bitcoin fully meets the definition of Islamic money under certain conditions and is generally permissible under Shariah. Blossom’s research also includes analysis of various legal opinions (fatawah) issued by prominent Islamic scholars on the topic. The research and development of the working paper was led by Mufti Muhammad Abu Bakar – Blossom’s internal Shariah advisor and Shariah compliance officer.

2. Who is Trading and Why?

Let’s examine another report on this recent price spike to see if there is a correlation on what occurred on April 12th.

Bitcoin, the most dominant cryptocurrency in the global market, recorded a 15.94 percent increase in value, from $6,900 to $8,000. The price of the cryptocurrency rose by $1,100 within a 30-minute window, as massive buy volumes emerged. […]

To influence the price of bitcoin, which has a daily trading volume of above $9 billion, billions of dollars would have to be traded. More importantly, billions of dollars worth of new capital have to flow into the cryptocurrency market in order for the price of bitcoin to spike up, and bring the entire market with it.

The April 12 surge in the price of bitcoin was not caused by investors cashing out from alternative cryptocurrencies (altcoins) to bitcoin or reallocating their funds from other major cryptocurrencies to bitcoin, because the valuation of the cryptocurrency market increased by more than $20 billion.

A wave of new investors or potentially a few institutional investors likely allocated billions of dollars into the market in a short period of time, causing a short-term pump and leading the price of the cryptocurrency to surge.

It is virtually impossible to pinpoint a single factor to justify the price trend of any cryptocurrency, because a variety of factors can contribute to the momentum of a cryptocurrency.

https://www.ccn.com/bitcoin-price

As we see from this article on CCN they report on the price surge however dismiss the ability to determine the cause of this price movement as “virtually impossible”. While this may be the case when examining the price movement of individual coins, it is different when the whole market moves in unison. When this occurs we seek further explanation to determine whether this movement is a short term spike, or if the market has moved up to another level. For hodlers an increase in TMC to a higher level is good news, although it depends if investment is of a centralized holder or a widely dispersed or decentralized population.

There is a potential of overlooking causes in the market or performing a superficial analysis if we do not include the TMC in our study. One market analyst attributes to the surge in Bitcoin price to other factors such as short positions as follows;

Brian Kelly, CNBC contributor and head of BKCM, which runs a digital assets strategy for clients said: ”Once bitcoin broke higher, shorts were squeezed and forced to cover.”

“The ratio of short margin trades versus longs has been increasing recently,” said Nick Kirk, quantitative developer and data scientist at Cypher Capital, a cryptocurrency trading firm. “Buying volume ticked up today and a lot of these short trades got liquidated, helping fuel the rally.”

https://www.express.co.uk//-news-update-cryptocurrency-latest-surge

Others relate the price surge to relief of upcoming tax filing deadlines compounded by short positions;

Some market participants believe that Thursday’s sudden upward price move “could be an unwinding of that (tax-related) pressure,” and the spike had a compounding effect as it “forced traders who had bet against the cryptocurrency to buy back into the market,” reports CNBC.

why-did-bitcoin-jump-1k-april-12

These analysis overlooks the overall increase of $25 billion to the TMC or the rally in the rest of the market. If the connection between the price rises and increase in TMC is being caused by a new population of investors representing 1.6 billion people, then this is a likely indication of more to come in the future and we are seeing the first wave of new capital enter markets.

3. On What Markets are They Trading?

Where these trades are being made is a more difficult task requiring some deeper digging into available data. If we find that all of the capital is coming into the market on only a few or one exchange then that would be indicative of a centralized actor in the market, while if we see more evenly traded entry across a number of markets this may indicate a wider dispersed population. At this time we have no information if any abnormal trading occurred on any market on April 12th except for an overall increase in volume. Deeper analysis is beyond the scope of this report, and I will leave it as an exercise for the interested reader.

Exploring the historical data records on CoinMarketCap it is revealed that the 24 hour trading volume went from $4,641,890,000 on April 11th to $8,906,250,000 on April 12th. Clearly the increase in trading volume of $4.3 billion is not the TMC of $25 billion, and we look also at the price increase to get an indication of the increase in MC. From the same data chart we read that MC increased from $118,048,000,000 to $134,114,000,000 for a total of $16.1 billion which would be a dominance factor of 0.64 on the increase of $25 billion TMC. Currently the Bitcoin dominance factor is at about 0.40 and has been rising.

Final Remarks

The forgoing analysis is not an exact science and as we can see relationships are not always inelastic. For example the increase in the TMC of $25 billion cannot be accounted for by the increase in Bitcoin trading volume of $4.3 billion divided by the Dominance Factor of 0.4 which would predict an increase in Total Trading Volume of $10.75 billion. This would indicate that there is a multiplier effect on invested capital to TMC. Also, capital is constantly flowing in and out of the markets and may change hands many times in one day. All of these and others unexamined factors may affect the TMC.

Events in this world form links in a causal chain, and often to manage best our resources information on relationships between various factors are important to understand when forming investing strategies or making budget decisions. Analysts provide qualified opinions on trends, and predictive market analysis is an important and valuable tool in decision making. Understanding fundamental market economics is essential to understanding cryptocurrency markets.
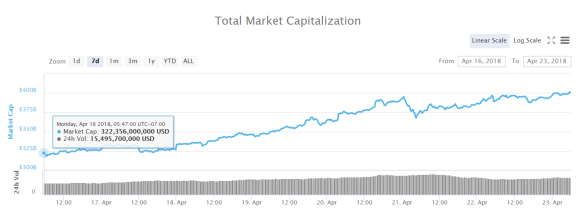


Chinese Blockbuster “Alibaba” Launches Cryptocurrency Mining Platform

[…When asked his feelings on digital currency, Ma claimed to be “totally confused,” explaining that “even if it works, the whole international rules on trade and financing are going to be completely changed.”

At the same time, Ma – whose net worth tops $46 billion – was quick to praise the advent of blockchain technology, suggesting his company had already looked into ways to harness this tool. …] (1)

Alibaba Group Holding Limited

(Chinese: 阿里巴巴集团控股有限公司; pinyin: Ālǐbābā Jítuán Kònggǔ Yǒuxiàn Gōngsī) is a Chinese multinational  e-commerce , retail, Internet and technology conglomerate founded in 1999 that provides consumer-to-consumer, business-to-consumer and business-to-business sales services via web portals, as well as electronic payment services, shopping search engines and data-centric cloud computing services. It also owns and operates a diverse array of businesses around the world in numerous sectors.[2]

In 2012, two of Alibaba’s portals handled 1.1 trillion yuan ($170 billion) in sales.[3] At closing time on the date of its initial public offering (IPO), 19 September 2014, Alibaba’s market value was US$231 billion.[4]

As of January 2018, Alibaba’s market cap stood at US$490 billion.[5] It is one of the top 10 most valuable and biggest companies in the world.[6]

References:

  1. alibaba-launching-crypto-platform
  2. Alibaba_Group – Wikipedia

How to Invest in CryptoCurrency – A Guide for Everyone

Of the many and diverse interests of mine, I include the emerging technology and upcoming revolution in finance, the CryptoCurrency [CC], Smart Contracts [SC] and the BlockChain [BC]. This makes sense as it fits in well with my technological background and interest in all things internet and information technology.

My first experiences with CC’s go back to 2012 when I was first looking at Bitcoin. I was interested in mining and how the various video cards of the day would perform to mine the BTC. Unfortunately, beyond doing some initial research and some trials with faucets in 2014, I did not invest early in Crypto. Some of the early amounts were still in present in my wallet and the small amount had grown considerably even left alone, from about $1 to $20 in a couple of years. This is shown in my current balance below.

Yesterday, January 13th 2018 marks a first. The day I spent my money on cryptocurrencies online and put myself at risk, and this is after much careful deliberation. I am starting with $200 (Canadian Dollars) with a plan of  investing $100 weekly in strategic ways to build my nest-egg. This will require some amount of discipline to maintain this schedule however I believe is doable and easy to duplicate.

Blueprints for Success – A New Blog

When someone finds a way to produce a product or service better than other’s they create an opportunity to profit from their advantage. My past experience working as a professional engineer in a number of consulting and design firms, including my own company, have proven that these methods work. It takes time, research, trial and error, and finally reporting.

Accumulating knowledge in a book is an evolving task and takes time. As I move forward, I plan to divest to you, the reader, my methods. What I did, how it is working, and other related concerns, opportunities or just prognostications. For this I will be creating a separate yet to be named and soon to be launched blog.

The First Steps – Make a Budget

Making the decision to start investing took some time on my part. Of course budgeting was crucial and ensuring that I had a stable source of income to commence a savings and investing program. I will be able to establish more detailed plans as my investment grows.

Wallets and Exchanges

This alone is a seemingly large and complicated topic. At present I will leave out most details and explanations for later posts, focus being on getting started.

At this time I am using Coinbase as both my on-line wallet and exchange.  Eventually I will have more wallets, some online, others on my digital devices. The wallet is where individual CC’s are digitally stored. These include online wallets, wallets stored on devices such as computers and phones, and hardware wallets. More later.

I created an account and linked my bank account via a Visa/debit Card which I already obtained from my bank for online purchases. I had done this a couple of weeks prior to making my first transaction.

Transaction Details

The first transactions were two purchases where I bought $100 of Bitcoin and $100 of Ethereum. The amounts include transaction fees and worked out to purchase 0.00538 BTC and 0.05557 ETH and have been detailed as seen in the screenshot.

ScreenShot - Coinbase - 01#1141018

Figure 1. Screenshot of Coinbase Cryptocurrency Transactions 

Also shown in the activity which is a third transaction I made to acquire some mining power, where some of the recently acquired BTC were forwarded to the provider from the Coinbase wallet.

Transaction Fees

To Be Discussed (TBD).

Mining

I decided to experiment with hiring some computing power online from the cloud using the provider FFLAK. Upon registration you receive a 14 day trial and 100 Gh/s mining power to mine Bitcoin. I upgraded to add mining of Ethereum at a rate of 2 Mh/s in one transaction using $40USD of BTC, and upgraded another 2 Mh/s with $40USD of LTC. See Transaction Fees.

On the calculator provided the projected return from my initial $80 investment annually is $348 after service fees deducted which is 435%. A pretty good rate of return, worth making an initial trial investment.

ScreenShot - FFLAK ETH Calculator- 03#1141018


Figure 2. FFLAK Mining CC Calculator

Prior to investing, I have been experimenting with mining and faucets. Since October of last year I have been mining a pre-ICO CC using my browser. This currency uses a novel approach to mining and I have accrued over 60 tokens over the past 4 months. Visit JSECoin to learn more.

ScreenShot - JSECoin - 02#1141018

Figure 3. JSE Coin Browser Mining Program

Faucets and Games

TBD.

ICO’s – Initial Coin Offerings and Airdrops

TBD.

Cryptocurrency and Value Propositions

TBD.

Disclaimer

No guarantees or warranties are implied or expressed by the author. Risks are inherent when investing in speculative ventures, and not all information may be included when opinion based statements and projections are made. The reader is advised to perform independent due diligence.

All readers and investors are assumed to be self-governing and able to formulate their own opinions and make independent decisions. No liability will be assumed by the author, his assigns, or the corporate entities mentioned in these published articles, for any losses.

Any payments made to the author are generated by referral links. These generate a small return and is the only financial reward provided to the author. This is in return for his time and expertise spent in sharing this valuable information to you the reader. Please follow the provided links as a small, no obligation courtesy.

Referral Links:

  1. Wallet and Exchange:  Coinbase 
  2. Mining Contract:  FFLAK
  3. Browser Mining: JSECoin