An Engineering Blockchain Cryptocurrency

The revolutionary aspect of the blockchain is starting serious discussions in the Professional Engineering community. Indications are that there are some fundamental problems in Engineering may be solved by the issuance of a token, in this case called Quant (1) and is currently in the “sand-box” phase of development.

The plan, in part, involves mining Quant to create a public key, or data-base called Engipedia.  There is also a “proof-of-stake” (2) aspect, which forms an engineer’s private key summarizing by algorithm the engineer’s personal data such as education, qualifications, projects, and other contributions or related works.

The Quant token, which is proposed to have inherent smart contract capabilities will be mined by engineers in a variety of ways, most of which are intended to establish an expanding  knowledge base, one such enterprise is called Engipedia. This is a knowledge base which has a formidable upside for democratic technological advancement and dissemination of workable knowledge worldwide.

As a virtual currency, the Quant token may provide a necessary bridge to financing that was previously inaccessible to engineers. Often pools of capital are controlled by vested interests or politically minded parties. Economic opportunities, which previously were unavailable due to lack of funding, may now have a financial vehicle for entrepreneurial Engineers.

The Design is the Contract

Engineering is different than finance and insurance. Finance and Insurance merely need to represent a physical object in a party / counter-party transaction script.  There is no design involved. Engineering represents a physical object – the engineering design and specification IS the smart contract. Then, what happens in construction, operations, maintenance, renovation, and replacement is far too complex to be scripted in a single smart contract. Engineering outcomes involve enormous mass, forces, and real-life consequences. (3)

References:

  1. The Market for QUANT
  2. QUANT Proof of Stake
  3. A Warning to Engineering Firms Concerning Blockchain Technology
Advertisement

An Engineer’s Take On Major Climate Change

Summary:
1. Climate science is very complicated and very far from being settled.

2. Earth’s climate is overwhelmingly dominated by negative-feedbacks that are currently poorly represented in our Modeling efforts and not sufficiently part of ongoing investigations.

3. Climate warming drives atmospheric CO2 upward as it stimulates all natural sources of CO2 emission. Climate cooling drives atmospheric CO2 downward.

4. Massive yet delayed thermal modulations to the dissolved CO2 content of the oceans is what ultimately drives and dominates the modulations to atmospheric CO2.

5. The current spike in atmospheric CO2 is largely natural (~98%). i.e. Of the 100ppm increase we have seen recently (going from 280 to 380ppm), the move from 280 to 378ppm is natural while the last bit from 378 to 380ppm is rightfully anthropogenic.

6. The current spike in atmospheric CO2 would most likely be larger than now observed if human beings had never evolved. The additional CO2 contribution from insects and microbes (and mammalia for that matter) would most likely have produced a greater current spike in atmospheric CO2.

7. Atmospheric CO2 has a tertiary to non-existent impact on the instigation and amplification of climate change. CO2 is not pivotal. Modulations to atmospheric CO2 are the effect of climate change and not the cause.

Watts Up With That?

Guest essay by Ronald D. Voisin

Let’s examine, at a high and salient level, the positive-feedback Anthropogenic Global Warming, Green-House-Gas Heating Effect (AGW-GHGHE) with its supposed pivotal role for CO2. The thinking is that a small increase in atmospheric CO2 will trigger a large increase in atmospheric Green-House-Gas water vapor. And then the combination of these two enhanced atmospheric constituents will lead to run-away, or at least appreciable and unprecedented – often characterized as catastrophic – global warming.

This theory relies entirely on a powerful positive-feedback and overriding (pivotal) role for CO2. It further assumes that rising atmospheric CO2 is largely or even entirely anthropogenic. Both of these points are individually and fundamentally required at the basis of alarm. Yet neither of them is in evidence whatsoever. And neither of them is even remotely true. CO2 is not only “not pivotal” but it…

View original post 4,012 more words

Entrepreneurial Value and Energy Conservation

014.JPG

Photo of Arbutus Mall, Vancouver

As an engineer and self-proclaimed entrepreneur I find myself value driven when seeking opportunities.  Usually value is something which can measured, whether it be in profit, market share, response rate, efficiency in operations and resource management, or other metric.  It may be to date unrecognized or otherwise under-utilized or untapped resource which can be subject to improvements or other opportunities.

Education of the market can be a daunting task, and getting recognition may be challenging.  However, perseverance and targeted marketing can eventually lead to opportunities where value can be recognized in a structured manner where a service contract may be offered to complete the scope of the determined project.  Here are some personal thoughts that I am putting down in a Q/A format:

Q.  Why do I write a blog?

A.  Writing a blog on energy in our built and constructed world has multiple benefits.  I get to practice my writing and research skills, learn new and emerging technology, meet new people, continue my growth as an individual and professional, and publish my research.

Q.  Why do I write about energy?

A.  One of the reasons I choose energy conservation and efficiency is my own understanding of how we can rationalize construction projects and work by building operations savings.  In the past with failing mechanical systems in buildings I have specified upgrades to the building plant to improve operations and partially pay for the repairs and upgrades by operational savings.

Q.  What kind of professional services are needed in buildings?

A.  To start we must to perform baseline measurements of the building.  Before changes are made so as to establish existing consumption rates of energy and water, as well as waste streams.  By doing this we can examine methods of reducing consumption rates and establish priorities for improvements and budget proposals for improvements in building equipment, the building envelope, electrical and lighting, as well as fixing ongoing problems or other deficiencies.  Generally speaking, a building energy audit and report is proposed start to this process, where an informal meeting with building staff, obtaining existing plans and doing an initial onsite inspection of operations and systems.

Q.  How can we achieve energy savings and be more green?

A.  Small and local things can add up, this is a fundamental tenet of conservation.  Every act gets examined, where is the waste, what can be reduced, is it needed, how can we do this differently.  All questions need to be asked and answered where an environment is occupied, and can be quite intensive where industry or other energy intensive commercial enterprise may be involved.

Q.  Why do I need an outside consultant or professional to perform this work?

A.  There are many tools a consultant can use and bring to the table with a client.   Knowledge and understanding of systems are important and how they fit together, someone who has experience in systems design, has worked in the field and can provide a service to either establish an initial plan to overseeing the entire project, including design, execution and final occupancy.

Q.  What else is important besides an energy audit?

A.  After an energy audit, building condition review and report may follow a request for proposal if it is determined by the client that repairs are required and a budget for these may be established prior to commencing work.  Within the proposal will be a preliminary scope or statement of work.


Measuring and Monitoring Energy Efficiency

Defining Energy Efficiency

To begin, let us ask what is energy efficiency, what are it’s components and how is it measured.  To make comparisons we need to gather data using measures relevant to the industry in question, also to the input forms of energy, waste streams and the useful work performed.  In the case of a building we may use meters to measure consumption or utility bills and compare changes in consumption rates over time.

To an engineer, energy efficiency is the ratio of useful work over total energy input.  For example, a room air conditioner’s efficiency is measured by the energy efficiency ratio (EER). The EER is the ratio of the cooling capacity (in British thermal units [Btu] per hour) to the power input (in watts).

On a grander scale we may be looking improvements over an industry or sector, changing fuel types in a utility such as the conversion of a coal plant to the production of power fueled by natural gas to reduce the carbon load on the environment.  Efficiency may be measured by different metrics depending on the result sought and may include the environmental impact of waste streams.

EnergyEfficientEconomy

Figure 1:  Historical Energy Use Graph  (1)

Whatever the exact yearly investment figure, the historical economic impact of efficiency is quite clear. As the graph () shows, efficiency has provided three times more of the economic services than new production since 1970:

The blue line illustrates demand for energy services (the economic activity associated with energy use) since 1970; the solid red line shows energy use; and the green line illustrates the gain in energy efficiency. While demand for energy services has tripled in the last four decades, actual energy consumption has only grown by 40 percent. Meanwhile, the energy intensity of our economy has fallen by half.

The area between the solid red line and the blue line represents the amount of energy we did not need to consume since 1970; the area between the dashed red line and the solid red line indicates how much energy we consumed since 1970.

The chart shows that energy efficiency met nearly three quarters of the demand for services, while energy supply met only one quarter.

“One immediate conclusion from this assessment is that the productivity of our economy may be more directly tied to greater levels of energy efficiency rather than a continued mining and drilling for new energy resources,” wrote Laitner. (1)

As noted in an article by the EIA;  The central question in the measurement of energy efficiency may really be “efficient with respect to what?” (2)  In general terms when discussing energy efficiency improvements we mean to perform more of a function with the same or less energy or material input.

Energy Efficiency Measures

Energy efficiency measures are those improvement opportunities which exist in a system which when taken will achieve the goals of achieving greater performance.  For example refer to Table 1 of Energy Efficiency Measures which can be effectively reduce energy consumption and provide an ROI of 5 or less years when applied to the commercial refrigeration industry.

energy efficient refrigeration4.jpg

Table 1:  Commercial Refrigeration Energy Efficiency Measures (3)


Government Action on Energy Efficiency

Energy efficiency has been put forward as one of the most effective methods in efforts to address the issue of Climate Change.  Recently, on February 19, 2015, President Obama signed Executive Order (EO) 13693.

“Since the Federal Government is the single largest consumer of energy in the Nation, Federal emissions reductions will have broad impacts.  The goals of EO 13693 build on the strong progress made by Federal agencies during the first six years of the Administration under President Obama’s 2009 Executive Order on Federal Leadership on Environmental, Energy and Economic Performance, including reducing Federal GHG emissions by 17 percent — which helped Federal agencies avoid $1.8 billion in cumulative energy costs — and increasing the share of renewable energy consumption to 9 percent.  

With a footprint that includes 360,000 buildings, 650,000 fleet vehicles, and $445 billion spent annually on goods and services, the Federal Government’s actions to reduce pollution, support renewable energy, and operate more efficiently can make a significant impact on national emissions. This EO builds on the Federal Government’s significant progress in reducing emissions to drive further sustainability actions through the next decade. In addition to cutting emissions and increasing the use of renewable energy, the Executive Order outlines a number of additional measures to make the Federal Government’s operations more sustainable, efficient and energy-secure while saving taxpayer dollars. Specifically, the Executive Order directs Federal agencies to:

– Ensure 25 percent of their total energy (electric and thermal) consumption is from clean energy sources by 2025.

– Reduce energy use in Federal buildings by 2.5 percent per year between 2015 and 2025.

– Reduce per-mile GHG emissions from Federal fleets by 30 percent from 2014 levels by 2025, and increase the percentage of zero emission and plug in hybrid vehicles in Federal fleets.

– Reduce water intensity in Federal buildings by 2 percent per year through 2025. ” (4)


Summary

Energy efficiency has gained recognition as a leading method to reduce the emissions of GHG’s seen to be the cause of climate change.  Under scrutiny, we find that there are different measures of efficiency across different industry, fuel types and levels.  For example on a micro-level, the functioning of a system may be improved by including higher efficiency components in it’s design, such as motors and pumps.

However, there are other changes which can improve efficiency.  Adding automated computer controls can improve a system level efficiency.   Utilities may change from coal burning to natural gas fired power plants, or industry may convert to a process to include for co-generation.  Battery storage and other technological improvements may come along to fill in the gap.

Historically Energy Efficiency measures have proven to be gaining ground by employing people with the savings earned when applying measures to reduce consumption.  These savings reverberate through the economy in a meaningful way, by reducing the need for the construction of more power plants as one example as we on an individual level.  We consume less energy, and using higher efficiency electronic equipment, and other energy savings measures at a consumer level, our communities are capable of more growth with existing energy supplies.

jEnergy production and consumption, as well as population growths also arise to other issues related to energy consumption, such as water consumption, water waste, and solid material waste.  Building with sustainable materials which promote healthy living environments is gaining importance as we understand the health impacts of a building’s environment on the health and well-being of the occupants.  Energy efficiency in the modern era, as we see from recent government mandates and sustainability programs, such as LEED’s for one, also includes for reductions in water intensity and incorporation of renewable energy programs as an alternative to increasing demand on existing utilities.


Related Blog Posts:

References

  1. http://www.greentechmedia.com/articles/read/report-u.s.-energy-efficiency-is-a-bigger-industry-than-energy-supply
  2. http://www.eia.gov/emeu/efficiency/measure_discussion.htm
  3. http://www.nwfpa.org/nwfpa.info/component/content/article/52-refrigeration/284-energy-efficient-refrigeration-systems
  4. https://www.whitehouse.gov/administration/eop/ceq/sustainability

The Smart Grid – Modern Electrical Infrastructure

When we talk about the emerging Smart Grid there comes with the topic an array of exciting and new technologies; Micro-Grids, Distributed Generation, Smart Meters, Load Shifting, Demand Response, Electric Vehicles with Battery Storage for Demand Response, and more.  Recent development in Renewable Energy sources has been driven by concerns over Climate Change, allowing for unprecedented growth in residential and commercial PV Solar Panel installations.

redwoodhighschool.jpg

Figure 1:  Redwood High School in Larkspur, CA installed a 705kW SunPower system that’s projected to save $250,000 annually. The carports include EV charging stations for four cars. (1)

Climate Change and burning of fossil fuels are hot topics in the world. Most recently the city of San Francisco has mandated the installation of solar panels on all new buildings constructed under 10 storeys, which will come into effect in 2017 as a measure to reduce carbon emissions.  Currently all new buildings in California are required to set aside 15% of roof area for solar. (2)

“Under existing state law, California’s Title 24 Energy Standards require 15% of roof area on new small and mid-sized buildings to be “solar ready,” which means the roof is unshaded by the proposed building itself, and free of obtrusions. This state law applies to all new residential and commercial buildings of 10 floors or less.

Supervisor Wiener’s ordinance builds on this state law by requiring this 15% of “solar ready” roof area to have solar actually installed. This can take the form of either solar photovoltaic or solar water panels, both of which supply 100% renewable energy.” (3)

Weather and Aging Infrastructure:

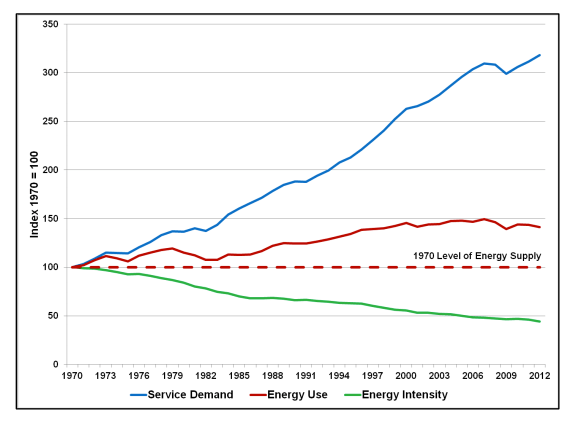
Despite an increasing abundance of energy-efficient buildings and other measures, electricity demand has risen by around 10% over the last decade, partly driven by the massive growth of digital device usage and the expanding demand for air conditioning, as summers continue to get hotter in many states.

According to 2013 data from the Department of Energy (DOE), US power grid outages have risen by 285% since records on blackouts began in 1984, for the most part driven by the grid’s vulnerability to unusual and extreme weather events – such as the devastating Hurricane Sandy in 2012 that caused extensive power outages across the East Coast – which are becoming less unusual as the years roll on.

“We used to have two to five major weather events per year from the 50s to the 80s,” said University of Minnesota Professor of Electrical and Computer Engineering Massoud Amin in a 2014 interview with the International Business Times.

“Between 2008 and 2012, major outages caused by weather increased to 70 to 130 outages per year. Weather used to account for about 17% to 21% of all root causes. Now, in the last five years, it’s accounting for 68% to 73% of all major outages.” (4)

How is the Smart Grid so different from the traditional electrical grid?

The established model of providing power to consumers involves the supply of electricity generated from a distant source and transmitted at high voltage to sub-stations local to the consumer, refer to Figure 2.  The power plants that generate the electricity are mostly thermo-electric (coal, gas and nuclear power), with some hydro-electric sources (dams and reservoirs) and most recently wind farms and large solar installations.

“The national power grid that keeps America’s lights on is a massive and immensely valuable asset. Built in the decades after the Second World War and valued today at around $876bn, the country’s grid system as a whole connects electricity from thousands of power plants to 150 million customers through more than five million miles of power lines and around 3,300 utility companies.” (4)

power_fig1 Old Grid Model.gif

Figure 2:  Existing Transmission and Distribution Grid Structure within the Power Industry (5)

The (Transmission & Distribution) market supplies equipment, services and production systems for energy markets. The initial stage in the process is converting power from a generation source (coal, nuclear, wind, etc.) into a high voltage electrical format that can be transported using the power grid, either overhead or underground. This “transformation” occurs very close to the source of the power generation.

The second stage occurs when this high-voltage power is “stepped-down” by the use of switching gears and then controlled by using circuit breakers and arresters to protect against surges. This medium voltage electrical power can then be safely distributed to urban or populated areas.

The final stage involves stepping the power down to useable voltage for the commercial or residential customer.  In short, while power generation relates to the installed capacity to produce energy from an organic or natural resource, the T&D space involves the follow up “post-power generation production” as systems and grids are put in place to transport this power to end users. (5)

The Smart Grid is an evolution in multiple technologies which in cases is overlaying or emerging from the existing grid.  New generating facilities such as wind power or solar installations which may be small or local to a municipal or industrial user are being tied into the existing grid infra-structure.  In some cases residential PV Solar systems are being tied into the Grid with some form of agreement to purchase excess energy, in some cases at rates favorable to the installer, depending on the utility and region.

Another characteristic of the evolving Smart Grid is in communication technology and scalability.  Use of wifi protocols for communication between parts of the system allow for new processes and access to resources which were previously unavailable.  Ability to control systems to defer demand to non-peak hours within a building as one example.

Microgrids, smaller autonomous systems servicing a campus of buildings or larger industry,  may plug into a larger City-wide Smart Grid in a modular manner.  In the event of a catastrophic event such as a hurricane or earthquake the Smart Grid offers users resiliency through multiple sources of energy supply.

Distributed Generation includes a number of different and smaller scale energy sources into the mix.  The newer, small scale Renewable Energy projects which are being tied to the electrical grid as well as other technologies such as Co-Generation, Waste To Energy facilities, Landfill Gas Systems, Geothermal and the like.  As growth continues there needs to be ways to control and manage these multiple energy sources into the grid.  Also increased needs to maintain privacy, isolate and control systems, and prevent unauthorized access and control.  This is leading to growth in  Energy Management and Security Systems.

ARES-rail-train

Figure 3:  An artist’s rendering of the massive rail used in the ARES power storage project to store renewable energy as gravitational potential energy. Source: ARES North America (6)

Energy Storage is emerging as necessary in the Smart Grid due to fluctuations in source supply of energy, especially Solar and Wind Power, and the intermittent and cyclical nature of user demand.   The existing grid does not have the need for energy storage systems as energy sources were traditionally large power stations which generally responded to anticipated need during the course of the day.

As more Renewable Energy systems go online the need for storage will grow.  Energy Storage in its various forms will also enable Load Shifting or Peak Shaving strategies for economic gains in user operations.  These strategies are already becoming commercially available for buildings to save the facility operators rate charges by limiting demand during peak periods at higher utility rates.

RTEmagicC_CSE1412_MAG_PP_FENERGY_Figure_1.jpg

Figure 4:  Effect of Peak Shaving using Energy Storage  (6) 

Peak-load shifting is the process of mitigating the effects of large energy load blocks during a period of time by advancing or delaying their effects until the power supply system can readily accept additional load. The traditional intent behind this process is to minimize generation capacity requirements by regulating load flow. If the loads themselves cannot be regulated, this must be accomplished by implementing energy storage systems (ESSs) to shift the load profile as seen by the generators (see Figure 4).

Depending on the application, peak-load shifting can be referred to as “peak shaving” or “peak smoothing.” The ESS is charged while the electrical supply system is powering minimal load and the cost of electric usage is reduced, such as at night. It is then discharged to provide additional power during periods of increased loading, while costs for using electricity are increased. This technique can be employed to mitigate utility bills. It also effectively shifts the impact of the load on the system, minimizing the generation capacity required. (6)

Challenges with chemical storage systems such as batteries are scale and cost.  Currently pumped hydro is the predominant method of storing energy from intermittent sources providing 99% of global energy storage. (7)

inline_demandresponse

Figure 5:  Actual Savings accrued due to Demand Response Program  (8) 

Demand Response (DR) is another technology getting traction in the Smart Grid economy. As previously mentioned Energy Management and Security Systems are “…converging with Energy Storage technology to make DR a hot topic.  First, the tools necessary to determine where energy is being stored, where it is needed and when to deliver it is have developed over decades in the telecommunications sector.  Secondly, the more recent rush of advanced battery research is making it possible to store energy and provide the flexibility necessary for demand response to really work. Mix that with the growing ability to generate energy on premises through solar, wind and other methods (Distributed Generation) and a potent new distributed structure is created.” (9)

Demand response programs provide financial incentives to reduce energy consumption during peak periods of energy demand. As utilities and independent system operators (ISOs) are pressured to keep costs down and find ways to get as many miles as they can out of every kilowatt, demand response programs have gained popularity. (8)

VirtualPowerPlant#1

Figure 6:  The Demonstration Project 2’s Virtual Power Plant (10) 

Virtual Power Plant: When an increasing share of energy is produced by renewable sources such as solar and wind, electricity production can fluctuate significantly. In the future there will be a need for services which can help balance power systems in excess of what conventional assets will be able to provide. Virtual power plants (VPPs) are one of the most promising new technologies that can deliver the necessary stabilising services.  (11)

In the VPP model an energy aggregator gathers a portfolio of smaller generators and operates them as a unified and flexible resource on the energy market or sells their power as system reserve.

VPPs are designed to maximize asset owners’ profits while also balancing the grid. They can match load fluctuations through forecasting, advance metering and computerized control, and can perform real-time optimization of energy resources.

“Virtual power plants essentially represent an ‘Internet of Energy,’ tapping existing grid networks to tailor electricity supply and demand services for a customer,” said Navigant senior analyst Peter Asmus in a market report. The VPP market will grow from less than US $1 billion per year in 2013 to $3.6 billion per year by 2020, according to Navigant’s research — and one reason is that with more variable renewables on the grid flexibility and demand response are becoming more crucial.  (12)

How-Microgrids-Work.jpg

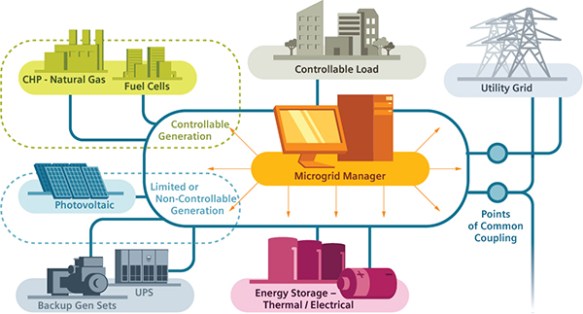
Figure 7:   Example of a Microgrid System With Loads, Generation, Storage and Coupling to a Utility Grid (13)

Microgrids:  Microgrids are localized grids that can disconnect from the traditional grid to operate autonomously and help mitigate grid disturbances to strengthen grid resilience (14).  The structure of a microgrid is a smaller version of the smart grid formed in a recursive  hierarchy where multiple local microgrids may interconnect to form the larger smart grid which services a region or community.

Summary:

The convergence of aging existing infrastructure, continued growth in populations and electrical demand and concerns over climate change have lead to the emerging smart grid and it’s array of new technologies.  This trend is expected to continue as new growth and replacement will be necessary for an aging electrical grid system, from the larger scope transmission systems and utilities, to smaller scale microgrids.  These systems will become integrated and modular, almost plug-and-play, with inter-connectivity and control through wireless internet protocols.

References:

  1. https://cleanpowermarketinggroup.com/category/blog/
  2. http://www.npr.org/sections/thetwo-way/2016/04/20/474969107/san-francisco-requires-new-buildings-to-install-solar-panels
  3. https://medium.com/@Scott_Wiener/press-release-board-of-supervisors-unanimously-passes-supervisor-wiener-s-legislation-to-require-693deb9c2369#.3913ug8ph
  4. http://www.power-technology.com/features/featureupgrading-the-us-power-grid-for-the-21st-century-4866973/
  5. http://www.incontext.indiana.edu/2010/july-aug/article3.asp
  6. http://www.csemag.com/single-article/implementing-energy-storage-for-peak-load-shifting/95b3d2a5db6725428142c5a605ac6d89.html
  7. http://www.forbes.com/sites/jamesconca/2016/05/26/batteries-or-train-pumped-energy-for-grid-scale-power-storage/#30b5b497de55
  8. http://www.summitenergygps.com/optimize-rebates-incentives-credits.html
  9. https://duanetilden.com/2015/12/26/demand-response-energy-distribution-a-technological-revolution/
  10. https://hub.globalccsinstitute.com/publications/twenties-project-final-report-short-version/demonstration-project-2-large-scale-virtual-power-plant-integration-derint
  11. http://energy.gov/oe/services/technology-development/smart-grid/role-microgrids-helping-advance-nation-s-energy-system
  12. http://www.renewableenergyworld.com/articles/print/volume-16/issue-5/solar-energy/virtual-power-plants-a-new-model-for-renewables-integration.html
  13. http://w3.usa.siemens.com/smartgrid/us/en/microgrid/pages/microgrids.aspx
  14. http://energy.gov/oe/services/technology-development/smart-grid/role-microgrids-helping-advance-nation-s-energy-system

Related Blog Posts:

Other Related Articles and Websites:

Solar Energy on Reservoirs, Brownfields and Landfills

One of the downsides to large-scale solar power is finding space suitable for the installation of a large area of PV panels or mirrors for CSP.  These are long-term installations, and will have impact on the land and it’s uses.  There are potential objections to committing areas of undeveloped or pristine land to solar power. 

Solar Energy on Reservoirs:

Floating arrays have been installed on surfaces such as water reservoirs as these “land areas” are already committed to a long-term purpose.  Solar power is considered a good synchronistic fit, and most recently work was completed in England seeing “23,000 solar panels on the Queen Elizabeth II reservoir at Walton-on-Thames”.   (1)

Water utilities are the first to see the benefit of solar panel installations as the power generated is generally consumed by the utilities operations for  water treatment and pumping.  This of course offsets demand requirements from the electrical utility and reduces operating costs with a ROI from the installation.  Possible government or other industry incentives and subsidies may enhance benefits.  Last year a 12,000 panel system was installed on a reservoir near Manchester (UK) and was the second of it’s kind in Britain, dwarfing the original installation of 800 panels.  (2)  (3)

Solar Array on Reservoir Japan MjcxMzAwOQ

Image #1:  World’s largest floating array of PV Solar Panels in Japan (4)

Currently Japan has the most aggressive expansion plans for reservoir installations, with the most recent being the world’s largest of it’s kind.  Recent changes in energy policies and the ongoing problems associated with Nuclear Power has propelled Japan into aggressively seeking alternative forms of energy.

The 13.7-megawatt power station, being built for Chiba Prefecture’s Public Enterprise Agency, is located on the Yamakura Dam reservoir, 75 kilometers east of the capital. It will consist of some 51,000 Kyocera solar modules covering an area of 180,000 square meters, and will generate an estimated 16,170 megawatt-hours annually. That is “enough electricity to power approximately 4,970 typical households,” says Kyocera. That capacity is sufficient to offset 8,170 tons of carbon dioxide emissions a year, the amount put into the atmosphere by consuming 19,000 barrels of oil.” 

“[…]“Due to the rapid implementation of solar power in Japan, securing tracts of land suitable for utility-scale solar power plants is becoming difficult,” Toshihide Koyano, executive officer and general manager of Kyocera’s solar energy group told IEEE Spectrum. “On the other hand, because there are many reservoirs for agricultural use and flood-control, we believe there’s great potential for floating solar-power generation business.”

He added that Kyocera is currently working on developing at least 10 more projects and is also considering installing floating installations overseas.” (4)

Solar Energy on Brownfields:

A Brownfield is defined generally by the EPA  (5)

A brownfield is a property, the expansion, redevelopment, or reuse of which may be complicated by the presence or potential presence of a hazardous substance, pollutant, or contaminant. It is estimated that there are more than 450,000 brownfields in the U.S. Cleaning up and reinvesting in these properties increases local tax bases, facilitates job growth, utilizes existing infrastructure, takes development pressures off of undeveloped, open land, and both improves and protects the environment.

Solar Brownfield 1 D6A13-0092.jpg

Image #2:  6-MW solar PV array on the site of the former Palmer Metropolitan Airfield (6)

Traditionally most solar projects have been built on “Greenfields”, however, on further analysis it makes far more sense to install solar on “Brownfields”.

The U.S. is home to more than 450,000 brownfields – unused property that poses potential environmental hazards. Eyesores as well as potential health and safety threats, brownfield sites reduce urban property values. Rehabilitating them pays off, and in more ways than one, according to a July, 2014 National Bureau of Economic Research (NBER) working paper entitled, ¨The Value of Brownfield Remediation.¨ […]

NBER researchers determined that remediation increased the value of individual brownfield sites $3,917,192, with a median value of $2,117,982. That compares to an estimated per-site cost of $602,000. In percentage terms across the study’s nationally representative sample, EPA-supported clean-ups resulted in property price increases of between 4.9% and 32.2%. (6)

In another example where a Brownfield remediation effort has payed off utilizing a Solar Power upgrade is at the Philadelphia Navy Yard according to a June 2011 report by Dave Levitan (7) where it says:

“The Navy Yard solar array is just one of a growing number of projects across the U.S. that fall into the small category of energy ideas that appear to have little to no downside: turning brownfields — or sites contaminated

Every solar project that rises from an industrial wasteland is one that won’t be built on pristine land.

or disturbed by previous industrial activity — into green energy facilities. Among the successfully completed brown-to-green projects are a wind farm at the former Bethlehem Steel Mill in Lackawanna, New York; a concentrating solar photovoltaic array on the tailings pile of a former molybdenum mine in Questa, New Mexico; solar panels powering the cleanup systems at the Lawrence Livermore National Laboratory’s Superfund site in northern California; and the U.S. Army’s largest solar array atop a former landfill in Fort Carson, Colorado.”

Solar Energy on Landfills:

Building solar power projects on top of closed off landfills appears to be a good idea, however, there are additional considerations and requirements which must be met which would exceed those of a normal type of undisturbed geology.

Construction and ongoing operation of the plant must never break, erode or otherwise impair the functioning integrity of the landfill final closure system (including any methane gas management system) already in place.”  (8) […]

A-Simple-Guide-to-Building-Photovoltaic-Projects-on-Landfills-and-Other-...-copy-3-291x300

Image #3:  Prescriptive Landfill Capping System

In general, the features of a conventional “Subtitle D” final protection barrier cover system on USA waste sites are shown in the illustration above and include the following layers added on top of a waste pile:

  1. First, a foundation Layer – usually soil—covers the trash to fill and grade the area and protect the liner.
  2. Then typically a geomembrane liner or a compacted clay layer .is spread over the site to entomb the waste mass in a water impermeable enclosure.
  3. A drainage layer (i.e. highly transmissive sands or gravels or a manufactured “Geonet”) is next added– especially in areas with heavy rainfall and steeper slopes. This is to prevent the sodden top layers of dirt from slipping off the impermeable barrier (a.k.a. a landslide).
  4. Next, typically 18 inches of soil is added as a “protection layer.”
  5. Finally, an “erosion layer” of soil – typically 6 inches of dirt of sufficient quality to support plant growth (grasses, etc., etc.) which the waste industry calls a “vegetative layer.”

Solar-landfill-table-lo-res

Image #4:  Established Solar Energy Projects on Closed Landfills (9)

As of 2013 we can see that there already have been a number of solar installations and that this number is still growing through to the present as more municipalities seek ways to convert their closed landfills into a renewable resource and asset.

Summary of Solar Energy Project Types by Site

A greenfield site is defined as an area of agricultural or forest land, or some other undeveloped site earmarked for commercial development or industrial projects.  This is compared to a brownfield site which is generally unsuitable for commercial development or industrial projects due to the presence of some hazardous substance, pollutant or contaminant.

While a water reservoir is not a contaminated site, it is generally rendered useless for most purposes, however provides an ideal site for locating solar panels as they provide relatively large areas of unobstructed sun.  Also reservoirs provide water cooling which enhances energy efficiency and PV performance.  Uncovered reservoirs can be partially covered by floating arrays of PV panels, of modest to large sizes in the 16 MW range.  Installations can be found throughout the world, including England and most recently Japan where interest in alternative energy sources is growing rapidly.

A brownfield site is considered ideal for the location of a solar plant as a cost-effective method of an otherwise useless body of land, such as a decommissioned mine, quarry, or contaminated site.  A landfill is one form of brownfield site which could be suitable for the installation of solar power where provision has been made to protect the cap on the landfill.  Municipalities have been showing growing interest in landfill solar as a means to offset operational costs.

Abbreviations:

PV – Photo Voltaic

CSP – Concentrated Solar Power

ROI – Return On Investment

UK – United Kingdom

NBER – National Bureau of Economic Research

EPA – Environmental Protection Agency

References:

  1. http://www.theguardian.com/environment/2016/feb/29/worlds-biggest-floating-solar-farm-power-up-outside-london
  2. http://www.telegraph.co.uk/finance/newsbysector/energy/11954334/United-Utilities-floats-3.5m-of-solar-panels-on-reservoir.html
  3. http://www.telegraph.co.uk/news/earth/energy/solarpower/11110547/Britains-first-floating-solar-panel-project-installed.html
  4. http://spectrum.ieee.org/energywise/energy/renewables/japan-building-worlds-largest-floating-solar-power-plant
  5. https://www.epa.gov/brownfields/brownfield-overview-and-definition
  6. http://microgridmedia.com/massachusetts-pv-project-highlights-benefits-of-solar-brownfields/
  7. http://e360.yale.edu/feature/brown_to_green_a_new_use_for_blighted_industrial_sites/2419/
  8. http://solarflexrack.com/a-simple-guide-to-building-photovoltaic-projects-on-landfills-and-other-waste-heaps/
  9. http://www.crra.org/pages/Press_releases/2013/6-3-2013_CRRA_solar_cells_on_Hartford_landfill.htm

Increasing Heat Island Effect’s Influence on Urban Temperature Records Introduces Bias in Climate Studies

When it comes to human-caused climate change, urban warming is a big player.

Sourced through Scoop.it from: www.cato.org

>”Perhaps no other climatic variable receives more attention in the debate over CO2-induced global warming than temperature. Its forecast change over time in response to rising atmospheric CO2 concentrations is the typical measure by which climate models are compared. It is also the standard by which the climate model projections tend to be judged; right or wrong, the correctness of global warming theory is most often adjudicated by comparing model projections of temperature against real-world measurements. And in such comparisons, it is critical to have a proper baseline of good data; but that is easier acknowledged than accomplished, as multiple problems and potential inaccuracies have been identified in even the best of temperature data sets.

One particular issue in this regard is the urban heat island effect, a phenomenon by which urban structures artificially warm background air temperatures above what they normally would be in a non-urbanized environment. The urban influence on a given station’s temperature record can be quite profound. In large cities, for example, urban-induced heating can be as great as Tokyo’s 10°C, making it all the more difficult to detect and discern a CO2-induced global warming signal in the temperature record, especially since the putative warming of non-urbanized areas of the planet over the past century is believed to be less than 1°C.  Yet, because nearly all long-term temperature records have been obtained from sensors initially located in towns and cities that have experienced significant growth over the past century, it is extremely important that urbanization-induced warming – which can be a full order of magnitude greater than the background trend being sought – be removed from the original temperature records when attempting to accurately assess the true warming (or cooling!) of the natural non-urban environment. A new study by Founda et al. (2015) suggests this may not be so simple or straightforward a task.

Working with temperature records in and around the metropolitan area of Athens, Greece, Founda et al. set out to examine the interdecadal variability of the urban heat island (UHI) effect, since “few studies focus on the temporal variability of UHI intensity over long periods.” Yet, as they note, “knowledge of the temporal variability and trends of UHI intensity is very important in climate change studies, since [the] urban effect has an additive effect on long term air temperature trends.”

[…]

Such findings as these are of significant relevance in climate change studies, for they clearly indicate the UHI influence on a temperature record is not static. It changes over time and is likely inducing an ever-increasing warming bias on the temperature record, a bias that will only increase as the world’s population continues to urbanize in the years and decades ahead. Consequently, unless researchers routinely identify and remove this growing UHI influence from the various temperature data bases used in global change studies, there will likely be a progressive overestimation of the influence of the radiative effects of rising CO2 on the temperature record. “<

See on Scoop.itGreen & Sustainable News

Transparent Solar Cells Could Turn Office Tower Windows and Mobile Devices Into Power Sources

“It’s a whole new way of thinking about solar energy,” says startup CEO about using transparent solar cells on buildings and electronics.

Sourced through Scoop.it from: news.nationalgeographic.com

>” […] With the help of organic chemistry, transparent solar pioneers have set out to tackle one of solar energy’s greatest frustrations. Although the sun has by far the largest potential of any energy resource available to civilization, our ability to harness that power is limited. Photovoltaic panels mounted on rooftops are at best 20 percent efficient at turning sunlight to electricity.

Research has boosted solar panel efficiency over time. But some scientists argue that to truly take advantage of the sun’s power, we also need to expand the amount of real estate that can be outfitted with solar, by making cells that are nearly or entirely see-through.

“It’s a whole new way of thinking about solar energy, because now you have a lot of potential surface area,” says Miles Barr, chief executive and co-founder of Silicon Valley startup Ubiquitous Energy, a company spun off by researchers at Massachusetts Institute of Technology and  Michigan State University. “You can let your imagination run wild. We see this eventually going virtually everywhere.”

Invisible Spectrum Power

Transparent solar is based on a fact about light that is taught in elementary school: The sun transmits energy in the form of invisible ultraviolet and infrared light, as well as visible light. A solar cell that is engineered only to capture light from the invisible ends of the spectrum will allow all other light to pass through; in other words, it will appear transparent.

Organic chemistry is the secret to creating such material. Using just the simple building blocks of carbon, hydrogen, oxygen, and a few other elements found in all life on Earth, scientists since at least the early 1990s have been working on designing arrays of molecules that are able to transport electrons—in other words, to transmit electric current.  […]

Harvesting only the sun’s invisible rays, however, means sacrificing efficiency. That’s why Kopidakis says his team mainly focuses on creating opaque organic solar cells that also capture visible light, though they have worked on transparent solar with a small private company in Maryland called Solar Window Technologies that hopes to market the idea for buildings.

Ubiquitous Energy’s team believes it has hit on an optimal formulation that builds on U.S. government-supported research published by the MIT scientists in 2011.

“There is generally a direct tradeoff  between transparency and efficiency levels,” says Barr. “With the approach we’re taking, you can still get a significant amount of energy at high transparency levels.”

Barr says that Ubiquitous is on track to achieve efficiency of more than 10 percent—less than silicon, but able to be installed more widely. “There are millions and millions of square meters of glass surfaces around us,” says Barr. […]”<

See on Scoop.itGreen Building Design – Architecture & Engineering

Water Vortex Hydro-Electric Power Plant Designs

In a fairly radical departure from the principles that normally govern hydroelectric power generation, Austrian engineer Franz Zotlöterer has constructed a low-head power plant that makes use of the kinetic energy inherent in an artificially induced vortex. The water’s vortex energy is collected by a slow moving, large-surface water wheel, making the power station transparent to fish – there are no large pressure differences built up, as happens in normal turbines.

Sourced through Scoop.it from: blog.hasslberger.com

>” […] The aspect of the power plant reminds a bit of an upside-down snail – through a large, straight inlet the water enters tangentially into a round basin, forming a powerful vortex, which finds its outlet at the center bottom of the shallow basin. The turbine does not work on pressure differential but on the dynamic force of the vortex. Not only does this power plant produce a useful output of electricity, it also aerates the water in a gentle way. Indeed, the inventor was looking for an efficient way to aerate the water of a small stream as he hit upon this smart idea of a plant that not only gives air to the medium but also takes from it some of the kinetic energy that is always inherent in a stream.

[…] Zotlöterer’s results are quite respectable. The cost of construction for his plant was half that of a conventional hydroelectric installation of similar yield and the environmental impact is positive, instead of negative.

The diameter of the vortex basin is 5 meters.

The head – difference between the two water levels – is 1,6 meters.

The turbine produced 50.000 kWh in its first year of operation.

Construction cost was 57.000 Euro […] “<

See on Scoop.itGreen Energy Technologies & Development

California Resort Hotel First to Upgrade to Energy Storage + EV Charging

Shore Hotel in Santa Monica, California, is a luxury establishment with an energy storage system and fast DC electric vehicle (EV) charging — reportedly, the first one in the US to have this setup. It is expected that the lithium-ion energy storage system will help it reduce electricity demand charges by 50%. Over time, that savings

Source: cleantechnica.com

>” […]  So what is the connection between energy storage and EV charging? When an EV is plugged into a charger, electricity demand increases, so the hotel could be on the hook for a high rate for the electricity, depending on the time of day. Demand charges are based on the highest rate for 15 minutes in a billing cycle. So, obviously, a business would want to avoid spikes in electricity usage so it would not have to pay that rate.

That’s where the energy storage comes in. When there is a spike, electricity can be used from the energy storage system, instead of from a utility’s electricity. Avoiding demand charges in this way, as noted above, can thus help businesses save money. […]”<

See on Scoop.itGreen Energy Technologies & Development