Solar and Energy Storage Set New Lows For Electricity Price in 2017

The year started with a solar-plus-storage record: AES inked a contract for a Kauai project at 11 cents per kilowatt-hour. The facility will combine 28 megawatts of solar photovoltaic capacity with 20 megawatts of five-hour duration batteries, producing 11 percent of the island’s electricity.

That project managed to outsize an earlier Tesla/SolarCity deal on the island and shave a few cents off the unit price. In May, another project made this one look like an appetizer.

Tucson Electric Power contracted with NextEra Energy Resources to build out a major solar-plus storage project at a 20-year PPA rate below 4.5 cents per kilowatt-hour. The facility will pair 100 megawatts of solar generation with a 30 megawatt/ 120 megawatt-hour storage system. (That’s as big as the AES Escondido system, which was the largest of its kind until Tesla outdid it in Australia).

That announcement turned heads and set of a flurry of number crunching, as analysts and rivals tried to unpack how such a low price could be possible. The investment tax credit plays a role, as does NextEra’s ability to source equipment at aggressive price points.

Crucially, this is happening in sunny Arizona, where the abundance of solar generation is creating value for dispatchable power. Storage thrives when its flexibility is compensated, and Arizona’s regulated utilities can do just that.

Full Story at: top-10-energy-storage-stories-of-2017

Flow Batteries: Developments in Energy Storage Systems (ESS)

The need for large scale storage solutions come to the forefront as a means to adjust supply to demand on the electrical grid.  Energy storage systems can adjust time of delivery to eliminate the need for peaker plants, allow for the addition of intermittent renewable energy sources such as wind and solar, or allow for large users to reduce facility operating costs by using a storage system to supplement energy supply reducing peak demand, most notably for summer A/C loads in buildings.

vanadium-flow-battery-wind-energy

Out of engineering research laboratories in materials science and electro-chemistry  are coming new energy storage systems designed for the future to solve these issues meanwhile opening up new enterprises and industry.  The characteristics of an ideal flow battery would include:  a long service life, modularity and scalability, no standby losses, chargeability, low maintenance, and safe.  In addition a flow battery will have to be economic compared to other systems which will need to be determined using LCOE analysis.

Related Articles:

  1. https://duanetilden.com/2015/01/27/determining-the-true-cost-lcoe-of-battery-energy-storage/
  2. https://duanetilden.com/2015/01/26/what-is-levelized-cost-of-energy-or-lcoe/
  3. https://duanetilden.com/2016/01/18/energy-storage-compared-to-conventional-resources-using-lcoe-analysis/
  4. https://duanetilden.com/2015/02/17/vanadium-flow-battery-competes-with-lithium-and-lead-acid-at-grid-scale/ 

Links:


Measuring and Monitoring Energy Efficiency

Defining Energy Efficiency

To begin, let us ask what is energy efficiency, what are it’s components and how is it measured.  To make comparisons we need to gather data using measures relevant to the industry in question, also to the input forms of energy, waste streams and the useful work performed.  In the case of a building we may use meters to measure consumption or utility bills and compare changes in consumption rates over time.

To an engineer, energy efficiency is the ratio of useful work over total energy input.  For example, a room air conditioner’s efficiency is measured by the energy efficiency ratio (EER). The EER is the ratio of the cooling capacity (in British thermal units [Btu] per hour) to the power input (in watts).

On a grander scale we may be looking improvements over an industry or sector, changing fuel types in a utility such as the conversion of a coal plant to the production of power fueled by natural gas to reduce the carbon load on the environment.  Efficiency may be measured by different metrics depending on the result sought and may include the environmental impact of waste streams.
EnergyEfficientEconomy

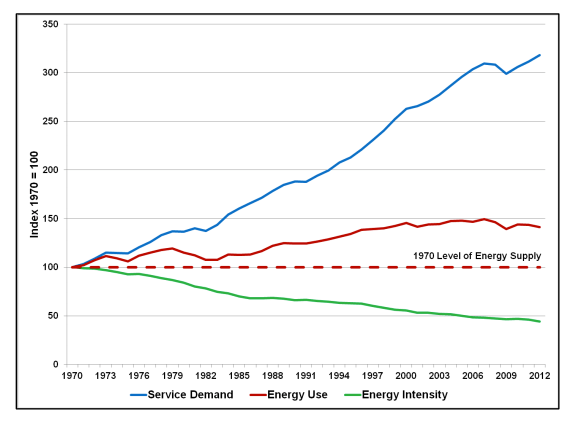
Figure 1:  Historical Energy Use Graph  (1)

Whatever the exact yearly investment figure, the historical economic impact of efficiency is quite clear. As the graph () shows, efficiency has provided three times more of the economic services than new production since 1970:

The blue line illustrates demand for energy services (the economic activity associated with energy use) since 1970; the solid red line shows energy use; and the green line illustrates the gain in energy efficiency. While demand for energy services has tripled in the last four decades, actual energy consumption has only grown by 40 percent. Meanwhile, the energy intensity of our economy has fallen by half.

The area between the solid red line and the blue line represents the amount of energy we did not need to consume since 1970; the area between the dashed red line and the solid red line indicates how much energy we consumed since 1970.

The chart shows that energy efficiency met nearly three quarters of the demand for services, while energy supply met only one quarter.

“One immediate conclusion from this assessment is that the productivity of our economy may be more directly tied to greater levels of energy efficiency rather than a continued mining and drilling for new energy resources,” wrote Laitner. (1)

As noted in an article by the EIA;  The central question in the measurement of energy efficiency may really be “efficient with respect to what?” (2)  In general terms when discussing energy efficiency improvements we mean to perform more of a function with the same or less energy or material input.

Energy Efficiency Measures

Energy efficiency measures are those improvement opportunities which exist in a system which when taken will achieve the goals of achieving greater performance.  For example refer to Table 1 of Energy Efficiency Measures which can be effectively reduce energy consumption and provide an ROI of 5 or less years when applied to the commercial refrigeration industry.

energy efficient refrigeration4.jpg

Table 1:  Commercial Refrigeration Energy Efficiency Measures (3)


Government Action on Energy Efficiency

Energy efficiency has been put forward as one of the most effective methods in efforts to address the issue of Climate Change.  Recently, on February 19, 2015, President Obama signed Executive Order (EO) 13693.

“Since the Federal Government is the single largest consumer of energy in the Nation, Federal emissions reductions will have broad impacts.  The goals of EO 13693 build on the strong progress made by Federal agencies during the first six years of the Administration under President Obama’s 2009 Executive Order on Federal Leadership on Environmental, Energy and Economic Performance, including reducing Federal GHG emissions by 17 percent — which helped Federal agencies avoid $1.8 billion in cumulative energy costs — and increasing the share of renewable energy consumption to 9 percent.  

With a footprint that includes 360,000 buildings, 650,000 fleet vehicles, and $445 billion spent annually on goods and services, the Federal Government’s actions to reduce pollution, support renewable energy, and operate more efficiently can make a significant impact on national emissions. This EO builds on the Federal Government’s significant progress in reducing emissions to drive further sustainability actions through the next decade. In addition to cutting emissions and increasing the use of renewable energy, the Executive Order outlines a number of additional measures to make the Federal Government’s operations more sustainable, efficient and energy-secure while saving taxpayer dollars. Specifically, the Executive Order directs Federal agencies to:

– Ensure 25 percent of their total energy (electric and thermal) consumption is from clean energy sources by 2025.

– Reduce energy use in Federal buildings by 2.5 percent per year between 2015 and 2025.

– Reduce per-mile GHG emissions from Federal fleets by 30 percent from 2014 levels by 2025, and increase the percentage of zero emission and plug in hybrid vehicles in Federal fleets.

– Reduce water intensity in Federal buildings by 2 percent per year through 2025. ” (4)


Summary

Energy efficiency has gained recognition as a leading method to reduce the emissions of GHG’s seen to be the cause of climate change.  Under scrutiny, we find that there are different measures of efficiency across different industry, fuel types and levels.  For example on a micro-level, the functioning of a system may be improved by including higher efficiency components in it’s design, such as motors and pumps.

However, there are other changes which can improve efficiency.  Adding automated computer controls can improve a system level efficiency.   Utilities may change from coal burning to natural gas fired power plants, or industry may convert to a process to include for co-generation.  Battery storage and other technological improvements may come along to fill in the gap.

Historically Energy Efficiency measures have proven to be gaining ground by employing people with the savings earned when applying measures to reduce consumption.  These savings reverberate through the economy in a meaningful way, by reducing the need for the construction of more power plants as one example as we on an individual level.  We consume less energy, and using higher efficiency electronic equipment, and other energy savings measures at a consumer level, our communities are capable of more growth with existing energy supplies.

jEnergy production and consumption, as well as population growths also arise to other issues related to energy consumption, such as water consumption, water waste, and solid material waste.  Building with sustainable materials which promote healthy living environments is gaining importance as we understand the health impacts of a building’s environment on the health and well-being of the occupants.  Energy efficiency in the modern era, as we see from recent government mandates and sustainability programs, such as LEED’s for one, also includes for reductions in water intensity and incorporation of renewable energy programs as an alternative to increasing demand on existing utilities.


Related Blog Posts:

References

  1. http://www.greentechmedia.com/articles/read/report-u.s.-energy-efficiency-is-a-bigger-industry-than-energy-supply
  2. http://www.eia.gov/emeu/efficiency/measure_discussion.htm
  3. http://www.nwfpa.org/nwfpa.info/component/content/article/52-refrigeration/284-energy-efficient-refrigeration-systems
  4. https://www.whitehouse.gov/administration/eop/ceq/sustainability

US Solar Growth Predicted to Double to 16 GW for 2016

Solar 2016

Image Credit:  GTM Research / SEIA U.S. Solar Market Insight
Source Credit:  March 9 (SeeNews)  by

“[…] The market will be driven by the utility-scale segment, which will account for 74% of annual installations following a rush to take advantage of the federal Investment Tax Credit (ITC) that was initially set to expire at the end of this year. The residential and commercial markets are also expected to see strong growth in 2016, though.

With the ITC now extended, state-level drivers and risks will move to the forefront in 2016, says the US Solar Market Insight Report 2015, published in conjunction with the Solar Energy Industries Association (SEIA).

In 2017, the US solar market is expected to shrink to 10 GW due to the pull-in of utility demand in 2016. “But between 2018 and 2020, the extension of the ITC will reboot market growth for utility PV and support continued growth in distributed solar as a growing number of states reach grid parity,” said GTM Research senior analyst Cory Honeyman. […]”
Source Link:  http://bit.ly/1LdMdRB

Virtual Power Plants Aggregate Renewable Energy Battery Storage Systems

Aggregating connected energy storage systems to create ‘virtual power plants’ is likely to become a big part of the next phase of storage, according to the executive director of the US-based Energy Storage Association.

Sourced through Scoop.it from: storage.pv-tech.org

>” […] Part of the beauty is that this kind of storage-based ‘multi-tasking’ could be secondary to the main aims of the storage being installed, such as integrating solar.

“You don’t have to do it every day, but on an infrequent basis you can jump into the marketplace to help make money and subsidise all your projects. And, you can do big things for the grid. You will look like a power plant as far as the grid can tell. You can replace the need for a new peaking plant or something like that. [There are] a lot of great things you can do with distributed storage; the sum of [its] parts is greater than the individual pieces.”

Companies are already trialling the concept in various configurations around the world, analyst Omar Saadeh, senior grid analyst at GTM Research, told PV Tech Storage recently. Saadeh said VPPs are one way utilities could use storage to meet “a higher demand for rapidly deployable grid flexibility”.

One example Saadeh cited was a project called PowerShift Atalantic in Canada, which was “designed to manage and mitigate intermittent power from large-scale wind generation, currently totalling 822MW”.

“Through the multiple flexible curtailment service providers, aggregated loads have the ability to balance wind intermittency by responding to virtual power plant dispatch signals in near-real time, providing the equivalent of a 10-minute spinning reserve ancillary service typically executed by pollution-heavy peaker plants,” Saadeh said.

“Since March 2014, the project included 1,270 customer-connected devices with 18 MW of load flexibility, approximately 90% residential.”

Saadeh said Europe has been especially active on the concept, calling France one of the “leading supporters” of such developments.

“They’ve looked at many promising applications including partial islanding, or microgrids, DER-oriented marketplace development, and renewable balancing services.”

German utility Lichtblick, which claims to generate its power 100% from renewables, is another entity which has already got started on VPPs, which it calls a “swarm” of devices. Its battery system providers in VPP programmes include Tesla Energy and Germany’s Sonnenbatterie. Meanwhile another big Tesla partner, SolarCity, also intends to aggregate storage using the EV maker turned energy industry disruptor’s Powerwall for homes. […]”<

See on Scoop.itGreen Energy Technologies & Development

Oil Well Waste Water Used to Generate Geothermal Power

The team took off-the-shelf geothermal generators and hooked them to pipes carrying boiling waste water. They’re set to flip the switch any day. When they do, large pumps will drive the steaming water through the generators housed in 40-foot (12-meter) containers, producing electricity that could either be used on site or hooked up to power lines and sold to the electricity grid.

Sourced through Scoop.it from: www.bloomberg.com

>”Oil fracking companies seeking to improve their image and pull in a little extra cash are turning their waste water into clean geothermal power.

For every barrel of oil produced from a well, there’s another seven of water, much of it boiling hot. Instead of letting it go to waste, some companies are planning to harness that heat to make electricity they can sell to the grid.

Companies such as Continental Resources Inc. and Hungary’s MOL Group are getting ready to test systems that pump scalding-hot water through equipment that uses the heat to turn electricity-generating turbines before forcing it back underground to coax out more crude.

Though the technology has yet to be applied broadly, early results are promising. And if widely adopted, the environmental and financial benefits could be significant. Drillers in the U.S. process 25 billion gallons (95 billion liters) of water annually, enough to generate as much electricity as three coal-fired plants running around the clock — without carbon emissions.

“We can have distributed power throughout the oil patch,” said Will Gosnold, a researcher at the University of North Dakota who’s leading Continental Resources’ project well.

Geothermal power also holds out the promise of boosting frackers’ green credentials after years of criticism for being the industry’s worst polluters, says Lorne Stockman, research director at Oil Change International, an environmental organization that promotes non-fossil fuel energy.

“This is one way to make it look like the industry cares about the carbon issue,” he said. Even if steam generates less carbon than other oil field power sources, “if you’re in the business of oil and gas, you’re not part of the solution.”

Cheap Oil

Then there’s the money. With crude at less than $50 a barrel, every little bit can help lower costs. At projects like the one being tested by Continental Resources in North Dakota, a 250 kilowatt geothermal generator has the potential to contribute an extra $100,000 annually per well, according to estimates from the U.S. Energy Department.

That’s not big money and the $3.4 million cost to test the technology is still too much to apply to each of Continental’s hundreds of wells. Yet if the company can lower the costs of the technology, it will not only generate electricity it will also extend the economic life of wells, making them more profitable, said Greg Rowe, a production manager with Continental Resources. […]”<

See on Scoop.itGreen Energy Technologies & Development

Rationale Behind Construction of Site C Dam on Peace River in BC Deeply Flawed

Thirty five years ago concerned ratepayers challenged BC Hydro, the BC Utilities Commission and the Provincial government to admit that electricity conservation and small power projects were preferable to flooding the farm lands of the Peace Valley. Building another dam was not the answer then, and it is not the answer today.

Image Credit:  http://www.straight.com

Sourced through Scoop.it from: vancouver.24hrs.ca

>” Roger Bryenton & Associates, 2015 […] Conservation, plus a variety of smaller, low impact green projects can save and produce more electricity at a lower cost, with less risk, than Site C.

British Columbia has demonstrated its responsibility to live in harmony with nature when building, living and developing resources; doing “more with less”. BC Hydro is to be commended on using conservation and Independent Power producers to supply a reliable and robust power system. Ratepayers recognize these efforts and will help by saving electricity, conservation, and using small scale, “flexible” projects which can readily be adjusted to changes in demand.

Presently, we are excluding the Columbia River Treaty benefits, Alcan and Teck-Cominco power resources, and time-of- use rates which could optimize the “provincial system”. Power from the Columbia River Treaty is being sold at market rates of 3 to 4 cents/kWh rather than be included in the supply equation, where it would be worth 8 to 10 (or more) cents/kWh. Alcan and Cominco have massive dams and plants that could contribute capacity when needed, while regulations presently prevent time-of-use rates to reduce peak demand, a technique used by leading utilities worldwide.

Site C is not needed for a number of reasons:

1. Columbia River Entitlement – Both the Capacity and the Annual Energy of Site C are close to what the Columbia River entitlement offers: Site C is 1,100MW and 5,100 GWh/yr while Columbia is 1,250 MW and 4,400 GWh/yr.

2. Cost – In the original submission, the cost estimate of Site C was $5.7 Billion, or $83/MWh (8.3 cents/kWh). During hearings this increased, first to $7.9 Billion , or $114/MWh (11.4 cents/kWh).  It has increased again, to the present $8.8 billion or $126 /MWh ( 12.6 cents /kWh). By BC Hydro’s own calculations, there are literally hundreds of clean, renewable small projects that can provide capacity and energy under $114, and many more under $126/MWh.

3. Timing – Even a small amount of new power will not be needed until 2027! A massive dam takes 8 to 10 years to complete. Conservation and small power plants require a few months to 3 years to complete. Building an 1,100 MW dam if we only need 100MW is “like using a sledge hammer to crack a nut” (A. Lovins). We will not need 1100MW even by 2033 when conservation and small plants can better follow growth .

4. Capacity – Firm Capacity is only needed for a few hours every year! We do not need a huge dam to do this.

– Time of use rates. By 2020 almost 400MW of savings at $31/kW-yr would be available by significantly shifting peak loads. BC Hydro does this operationally but has refused to include it in their submitted plan.
– Pumped storage at Mica and elsewhere is economical at these prices – we do not need to flood more farmland.
– Geothermal also offers firm capacity.
– An Agreement with Alcan for some peaking, a few hours each year is feasible, but not proposed in the Site C plan.

5. Energy – Conservation, doing “more with less”, has been effective during the past 35 years, when Site C hearings originally delayed this project!

“Deep DSM” – Demand-Side Management, Option 5 of BC Hydro’s Integrated Resource Plan, can save almost 1,600MW by 2020 with energy savings of 9,600 GWh/yr. This is almost 400MW and 2000 GWh/ yr more than DSM 2. The cost is only $49/MWh; roughly half of what Site C would cost!  […]”<

See on Scoop.itGreen Energy Technologies & Development

Comfort is key in a passive house

0620 home green  Rendering of the home Chris Weissflog, who operates the renewable energy firm Ecogen Energy, is building for his family. Among other green features, its solar panels will meet most of the 3,000-square-foot home’s heating and cooling needs as well as powering a greenhouse with an extended growing season. With story by Patrick Langston.

0620 home green Rendering of the home Chris Weissflog, who operates the renewable energy firm Ecogen Energy, is building for his family. Among other green features, its solar panels will meet most of the 3,000-square-foot home’s heating and cooling needs as well as powering a greenhouse with an extended growing season. With story by Patrick Langston.

>” […] The falling price of technology may still help us out of the quandary. The CHBA is currently developing a net zero and net zero-ready labelling program for home builders and renovators. A net zero home typically uses photovoltaic panels to produce as much energy as it consumes, generally selling excess electricity to the grid. A net zero-ready home is set up for, but does not include, the photovoltaic system.

The CHBA’s Foster says that a net zero home including photovoltaic panels now costs $50,000 to $70,000 more than a conventional home. That’s 50 per cent of the cost of just five years ago, and the price of PV panels continues to drop.

With rising energy prices, the CHBA says the extra monthly mortgage costs associated with a net zero home are now comparable to the savings in energy costs, making it net zero in more ways than one. […]”<

Economist reports proposed Site C Dam ‘dramatically’ more costly than BC gov’t claims

Peace Valley Landowners Association commissioned leading U.S. energy economist, Robert McCullough, to look at the business case for what will be province’s most expensive public infrastructure project

Image source:  http://unistotencamp.com/?p=601

Source: www.theglobeandmail.com

>”Just weeks before BC Hydro plans to begin construction of the $8.8-billion Site C project, a new report says the Crown corporation has dramatically understated the cost of producing power from the hydroelectric dam.

…Mr. McCullough, in his report, said it appears the Crown corporation BC Hydro had its thumbs on the scale to make its mega project look better than the private-sector alternatives.

“Using industry standard assumptions, Site C is more than three times as costly as the least expensive option,” Mr. McCullough concluded. “While the cost and choice of options deserve further analysis, the simple conclusion is that Site C is more expensive – dramatically so – than the renewable [and] natural gas portfolios elsewhere in the U.S. and Canada.”

The report challenges a number of assumptions that led the government to conclude that Site C is the cheapest option. Mr. McCullough noted that the province adopted accounting changes last fall that reduced the cost of power generated by Site C. He said those changes are illusory and the costs will eventually have to be paid either by Hydro ratepayers, or provincial taxpayers.

Mr. McCullough, a leading expert on power utilities in the Pacific Northwest, also disputes the rate that BC Hydro used to compare the long-term borrowing cost of capital for Site C against other projects, noting that other major utilities in North America use higher rates for such projects because they are considered risky investments. The so-called discount rate is critical to the overall cost projections, and he said the paper trail on how the Crown arrived at its figure “can only be described as sketchy and inadequate.”

The report, obtained by The Globe and Mail, will be released on Tuesday by the PVLA.

The group will call on Premier Christy Clark to delay construction to allow time for a review by Auditor-General Carol Bellringer.

Ken Boon, president of the association, said the government needs to put the project on hold because it has approved the project based on poor advice. […]”<

See on Scoop.itGreen & Sustainable News

Wind Turbines

Rotronic - BLOG

Its been pretty windy recently, So wind farms are probably doing quite well at the moment. The biggest wind farm in the world, at the moment, is the London array, which can produce 630MW of power.

Wind Energy in General

The future is very encouraging for wind power. The technology is growing exponentially due to the current power crisis and the ongoing discussions about nuclear power plants. Wind turbines are becoming more efficient and are able to produce increased electricity capacity given the same factors.

Facts & figures:

There is over 200 GW (Giga Watts) of installed wind energy capacity in the world.

The Global Wind Energy Council (GWEC) has forecasted a global capacity of 2,300 GW by 2030. This will cover up to 22% of the global power consumption.

WindPower
Converting wind power into electrical power:

A wind turbine converts the kinetic energy of wind into rotational mechanical energy. This energy is directly converted, by a generator, into electrical energy. Large wind turbines typically have a generator installed on top of the tower. Commonly, there…

View original post 489 more words