Why Demand Response will shape the future of Energy

Matching supply to demand is crucial when it comes to energy — and this concept can help us do it.

Source: www.mnn.com

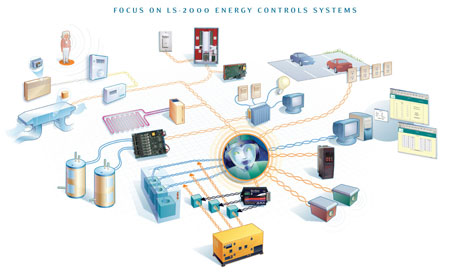
>” […] Our energy grid is not designed to put out a steady amount of energy throughout the day. Rather, it is designed to crank up or wind down depending on the amount of energy that’s being demanded by the markets.

That means there’s a baseload of generation that’s always on — churning out steady amounts of relatively cheap, dependable power night and day. This has typically been made up of coal and nuclear plants, which can produce large amounts of power but can’t be made to cycle up and down efficiently in the face of fluctuating demand. On top of the baseload, you have an increasing amount of intermittent sources as the world transitions to renewable energy technologies like wind and solar. And then, on top of these intermittent sources are so-called “peaking” plants, often running on natural gas and sometimes diesel or even jet fuel. These can be deployed at very short notice, when there’s either unusually high demand or when another source isn’t available (e.g. the sun isn’t shining enough for solar), but are expensive, inefficient and disproportionately polluting.  One of the most effective ways to meet this challenge also happens to be the simplest — reward people for not using energy when it’s in highest demand.

An old idea whose time has come
Demand response, as it is known by those in the industry, is really not all that new. Many utilities have offered cheaper electricity rates for off-peak hours, encouraging consumers to shift their habits and reduce the pressure on the peak. Similarly, energy producers around the world have partnered with energy-hungry industries to ask them to power down at times of high demand. What’s new, however, is an ever more sophisticated array of technologies, meaning more people can participate in demand response schemes with less disruption to their daily lives. […]

A more sophisticated approach
On the commercial side, demand response has been a strategy for some time because it took very little infrastructure to implement — just an energy-hungry business ready and willing to cut its consumption in times of need, and able to educate its workforce about how and why to do so. Here too, however, the concept is becoming a lot more sophisticated and scalable as technology allows us to better communicate between producers and consumers, and to coordinate the specific needs of the grid. And as distributed energy storage becomes more commonplace, consumers may not even have to modulate their overall use — but rather allow the utility to switch them to battery power when grid supply is constrained. […]

A huge potential to cut peak demand
A report from federal regulators suggests that U.S. demand response capacity had the potential to shave 29GW off of peak demand in 2013, representing a 9.9 percent increase over 2012. When the U.K.’s National Grid, which manages the nation’s transmission infrastructure, put out a call for companies willing to cut consumption at key times, over 500 different sites came forward. The combined result was the equivalent of 300MW of power that can be removed from the grid at times of need. And constrained by its rapid growth of renewables following the Fukushima disaster, Japan is now looking at shoring up its grid by starting a national demand response program in 2016. […]”<

See on Scoop.itGreen Energy Technologies & Development

Advertisement

Reduce Costs and Energy Use Through Elevator Efficiency Upgrades

Buying or installing elevator equipment that promotes low-energy consumption can help save money and reduce a building’s environmental footprint.

Source: highrisefacilities.com

>”As part of a building’s overall energy usage, elevators consume up to 10 percent of the total energy in a building. From an environmental standpoint, the most significant impact elevators have is the electricity use while the elevator is in service. Therefore, buying or installing elevator equipment that promotes low-energy consumption can help save money and reduce a building’s environmental footprint.

Buildings and Energy

One way to measure overall energy usage is by calculating the power factor (PF) of the building and/or its energy-consuming devices. These are generally motors, transformers, high intensity discharge (HID) lighting, fluorescent devices or other pieces of equipment that require magnetism to operate. […]

Power factor is a measurement of electrical system efficiency in the distribution and consumption of electrical energy. It is the percentage of the amount of electric power being provided that is converted into real work and expressed as a number between zero and one. For example, if a device had a .70 PF, then 70 percent of the power that the utilities generate to run the device is actually being converted into real work. The lower the PF number, the poorer the PF efficiency. The higher the PF number, the greater the PF efficiency.

In some areas, utilities use PF in the computation of the demand charge. A low PF for a customer’s facility could result in a demand charge penalty that increases the monthly demand cost. This is where newer, more innovative elevator control systems can contribute to lower energy consumption and improve a buildings’ overall PF.

Because of electrical losses caused during generation, distribution and consumption of electricity, the amount of power needed to be provided by a utility company will be greater than the amount for which they get paid by consumers.

Comparative Analysis

During a recent modernization of two identical traction elevators, before and after energy data was collected. The original, first generation silicon controlled rectifier (SCR), direct current (DC) motor control was measured using a series of fixed run patterns and known loads. After modernization, the new insulated-gate bipolar transistor (IGBT)-based alternating current (AC) motor control for a permanent magnet synchronous motor system was measured using the same run patterns and known loads.

The SCR-DC system used far more energy (watts/hour) to move the exact same load through the exact same distance compared to the IGBT-based permanent magnet AC control (Chart 1). In fact, in these six load tests, the IGBT-based system used less than half the energy. An incredible 383 percent increase in power factor of the IGBT-based system compared to the SCR-DC system (Chart 2). That means more of the energy consumed was being converted into real work with less waste in terms of heat and magnetism.

These kinds of energy usage reductions and PF increases are becoming even greater as newer elevator technology gets incorporated into buildings (Chart 3).

It’s easy to see how reducing energy consumption and increasing power rating can benefit the building’s owners and operators. However, these same improvements benefit the community as well. The electricity not being used in one building can be used by other customers — allowing utilities to meet the community’s electricity demand without increasing electricity generation. That translates into no rolling blackouts or brownouts, no new power plants being built and an overall smaller environmental footprint.

Hydraulic Elevators

Up to this point, traction elevator technology was discussed where wire ropes pull the elevator from above the car. In contrast, the hydraulic elevator pushes the elevator cab through the hoistway. The way a hydraulic system works is a piston and cylinder are sunk in the ground below the elevator. To go up, a pump forces oil from an oil tank reservoir into the cylinder — causing the piston to rise, making the elevator cab go up. To go down, gravity and the weight of the cab pushes the piston down into the cylinder and forces the hydraulic oil back into the tank reservoir. Historically, hydraulic elevators (or hydros) have been installed where either the building had fewer floors (typically six to eight) or lower material and installation costs were a consideration (when compared to a traction elevator). […]

Considerations Beyond the Hoistway

Energy reduction of a building’s elevators can also impact heating, ventilation and air conditioning (HVAC) systems. Quite often, elevator machine rooms are air conditioned to support removal of the heat generated by elevator control systems. Motor-generator-based elevator controls create a tremendous amount of heat; the effect is multiplied when several systems are contained in the same machine room.

Additionally, a check should be made of the shut-down timer typically employed with motor-generators (M-G) sets. Is it working? Does the M-G set turn off after a set period of time? Or has the timer failed and no longer shuts down the motor-generator, wasting energy as the M-G set turns but no work is being done by the elevator?

The elevator cab’s lighting can impact both the energy consumption and HVAC systems. A recent survey conducted of a 34-story high rise office building with 18 elevators showed the cab lights were on 24-hours a day. There are 28 incandescent light bulbs per elevator. That worked out to 100-amps of power being consumed continuously. By replacing the incandescent bulbs with compact fluorescents, energy consumption could be cut to 30 percent. And if a 24-hour clock timer is added to shut the lights off at midnight, even more energy could be saved.

Reducing Energy Consumption

Finally, if you’re considering an elevator modernization, call your electric provider or visit their Website to explore the possibility of energy rebates from the local utility provider. It is quite common for utilities to offer dollar incentives for specific building improvements that reduce energy consumption and improve PF.

There are various benefits to building owners and facility managers who lower their power consumption and understand how power factor helps reduce the overall cost of energy, particularly the energy used to run the elevators in their buildings. These benefits go beyond the elevators themselves to include benefits derived from HVAC systems, cab lighting and energy consumed when the elevators are not moving that affect the monthly utility bill.”


See on Scoop.itGreen Energy Technologies & Development

Study Finds Global Opportunities for Improvements in Elevator Efficiency

1259707a-d405-4e90-9e4b-4b7660c1a1d0.jpgElevators and escalators make up 2 to 5 percent of the energy used in most buildings, but can reach as high as 50 percent during peak operational times. At 5 percent, that means the yearly energy consumption of U.S. elevators is approximately five times of that used in all of Washington D.C.


image source: http://www.thyssenkrupp.com/en/produkte/energieeffiziente-aufzugssysteme.html

Source: aceee.org

>”Chicago—More energy-efficient elevators can significantly reduce the costs of operating a building, but the information needed to help building owners identify the appropriate elevator system—and the savings associated with it—aren’t readily available, according to a new study published by a leading policy group. The study, by the American Council for an Energy-Efficient Economy, was published with the support of UTC Building & Industrial Systems, the parent organization of Otis, the world’s largest manufacturer and maintainer of people-moving products.

[…] The technology exists today to reduce that consumption by 40 percent or more, especially by cutting energy use between trips, when an elevator is idle, according to the study. Some technologies have been found to reduce consumption by as much as 75 percent, but without a standard way to measure energy savings and a rating system to distinguish more efficient elevators, building owners may be unaware of the benefits of upgrading to a more efficient system or choosing a more efficient system for new construction.

“Enhanced visibility when it comes to elevator efficiency can help customers grasp the full value package of better controls, improved performance, reduced sound, and increased comfort,” said Harvey Sachs, ACEEE senior fellow, and the study’s lead author. Sameer Kwatra of ACEEE presented the study on Tuesday, January 27 at the 2015 American Society of Heating, Refrigerating and Air-Conditioning Engineers (ASHRAE) Winter Conference in Chicago.

The study lays out a framework for industry leaders to set common standards for measuring elevator efficiency. Those standards could lead to a rating system, such as the U.S. Environmental Protection Agency’s ENERGY STAR® ratings already in place for heating, ventilating and air-conditioning systems, and many home appliances. Clear standards also could lead energy utilities and government agencies to offer incentives, such as rebates, for very efficient models. And building label programs, such as the U.S. Green Building Council’s LEED® program, could include elevator efficiency as a factor in certifying buildings. Right now, the LEED program considers elevators a part of unregulated “process loads,” and there are no direct credits for installing more efficient systems.

“Owners see elevators as an extension of the building lobby — a way to include their personality and values in the building,” said John Mandyck, chief sustainability officer, UTC Building & Industrial Systems. “As consumers and tenants better understand and value the effects green buildings have on the health and productivity of inhabitants, clear standards for measuring elevator efficiency can provide a great opportunity to reduce operating costs and showcase the environmental attributes of a building.”

The report identified energy-efficient elevator technologies that can be included in building codes and factored in elevator rating and labeling systems. […]”<

See on Scoop.itGreen Building Design – Architecture & Engineering

Determining the True Cost (LCOE) of Battery Energy Storage

The true cost of energy storage depends on the so-called LCOE = Round-trip efficiency + maintenance costs + useful life of the energy system

Source: www.triplepundit.com

By Anna W. Aamone

“With regard to [battery] energy storage systems, many people erroneously think that the only cost they should consider is the initial – that is, the cost of generating electricity per kilowatt-hour. However, they are not aware of another very important factor.

This is the so-called LCOE, levelized cost of energy(also known as cost of electricity by source), which helps calculate the price of the electricity generated by a specific source. The LCOE also includes other costs associated with producing or storing that energy, such as maintenance and operating costs, residual value, the useful life of the system and the round-trip efficiency. […]

Batteries and round-trip efficiency

[…] due to poor maintenance, inefficiencies or heat, part of the energy captured in the battery is released … or rather, lost. The idea of round-trip efficiency is to determine the overall efficiency of a system (in that case, batteries) from the moment it is charged to the moment the energy is discharged. In other words, it helps to calculate the amount of energy that gets lost between charging and discharging (a “round trip”).

[…] So, as it turns out, using batteries is not free either. And it has to be added to the final cost of the energy storage system.

Maintenance costs

[…] An energy storage system requires regular check-ups so that it operates properly in the years to come. Note that keeping such a system running smoothly can be quite pricey. Some batteries need to be maintained more often than others. Therefore when considering buying an energy storage system, you need to take into account this factor. […]

Useful life of the energy system

Another important factor in determining the true cost of energy storage is a system’s useful life. Most of the time, this is characterized by the number of years a system is likely to be running. However, when it comes to batteries, there is another factor to take into account: use. […]

More often than not, the life of a battery depends on the number of charge and discharge cycles it goes through. Imagine a battery has about 10,000 charge-discharge cycles. When they are complete, the battery will wear out, no matter if it has been used for two or for five years.

[…] [However] flow batteries can be charged and discharged a million times without wearing out. Hence, cycling is not an issue with this type of battery, and you should keep this in mind before selecting an energy storage system. Think twice about whether you want to use batteries that wear out too quickly because their useful life depends on the number of times they are charged and discharged. Or would you rather use flow batteries, the LCOE of which is much lower than that of standard batteries?

So, what do we have so far?

LCOE = Round-trip efficiency + maintenance costs + useful life of the energy system.

These are three of the most important factors that determine the LCOE. Make sure you consider all the factors that determine the true cost of energy storage systems before you buy one.

Image credit: Flickr/INL”

See on Scoop.itGreen Energy Technologies & Development

What is “Levelized Cost of Energy” or LCOE?

As a financial tool, LCOE is very valuable for the comparison of various generation options. A relatively low LCOE means that electricity is being produced at a low cost, with higher likely returns for the investor. If the cost for a renewable technology is as low as current traditional costs, it is said to have reached “Grid Parity“.

Source: www.renewable-energy-advisors.com

>”LCOE (levelized cost of energy) is one of the utility industry’s primary metrics for the cost of electricity produced by a generator. It is calculated by accounting for all of a system’s expected lifetime costs (including construction, financing, fuel, maintenance, taxes, insurance and incentives), which are then divided by the system’s lifetime expected power output (kWh). All cost and benefit estimates are adjusted for inflation and discounted to account for the time-value of money. […]

LCOE Estimates for Renewable Energy

When an electric utility plans for a conventional plant, it must consider the effects of inflation on future plant maintenance, and it must estimate the price of fuel for the plant decades into the future. As those costs rise, they are passed on to the ratepayer. A renewable energy plant is initially more expensive to build, but has very low maintenance costs, and no fuel cost, over its 20-30 year life. As the following 2012 U.S. Govt. forecast illustrates, LCOE estimates for conventional sources of power depend on very uncertain fuel cost estimates. These uncertainties must be factored into LCOE comparisons between different technologies.

LCOE estimates may or may not include the environmental costs associated with energy production. Governments around the world have begun to quantify these costs by developing various financial instruments that are granted to those who generate or purchase renewable energy. In the United States, these instruments are called Renewable Energy Certificates (RECs). To learn more about environmental costs, visit our Greenhouse Gas page.

LCOE estimates do not normally include less tangible risks that may have very large effects on a power plant’s actual cost to ratepayers. Imagine, for example, the LCOE estimates used for nuclear power plants in Japan before the Fukushima incident, compared to the eventual costs for those plants.

Location

An important determination of photovoltaic LCOE is the system’s location. The LCOE of a system built in Southern Utah, for example, is likely to be lower than that of an identical system built in Northern Utah. Although the cost of building the two systems may be similar, the system with the most access to the sun will perform better, and deliver the most value to its owner. […]”<


See on Scoop.itGreen Energy Technologies & Development

CanGEA Report Claims Geothermal Creates more Jobs than Site C Dam

a recent report by a canadian industry group that is promoting geothermal energy, thermal energy generated and stored in the earth, says geothermal operations can create more permanent jobs than the site c dam in northeastern b.c.

Source: www.journalofcommerce.com

>”According to Geothermal Energy: The Renewable and Cost Effective Alternative to Site C, 1,100 megawatts – the same amount as Site C – of geothermal power projects would create more sustainable employment for surrounding communities.

“While Site C promises only 160 permanent jobs, U.S. Department of Energy statistics indicate that the equivalent amount of geothermal energy would produce 1,870 permanent jobs. This does not include jobs that result from the direct use of geothermal heat, which are also significant.”

However, said Alison Thompson, managing director of Canadian Geothermal Energy Association  (CanGEA), which published the report, geothermal projects would result in fewer construction jobs than the Site C dam.

“Geothermal projects would be spread around the province, not all on one site,” she said. “And, unlike Site C, they would not be built all at once. They would be staggered, with construction beginning in the highest-priority regions first.”

According to Dave Conway, a Site C spokesman, the $7.9 billion project will create about 10,000 person-years of direct construction employment, and 33,000 person-years of total employment during development and construction.

Construction will take about eight years.  This includes seven years for  the construction itself and one year for commissioning, site reclamation and demobilization.

Thompson said geothermal energy has other advantages over hydro.  “For example, geothermal power has a lower unit energy cost and capital cost,” she said.  “And, the physical and environmental footprint of geothermal is small.”

The CanGEA report says the “strategic dispersion” of geothermal projects will have lower transmission costs than Site C.

“There is every reason to believe that, given the thoughtful and (methodical) development of B.C.’s geothermal potential, geothermal power could provide all of B.C.’s future power requirements at a lower cost to ratepayers than the proposed Site C project.” […]

“For the most part, Canada’s geothermal power sector lay dormant for the following two decades while interest in the industry continued to grow outside of Canada’s borders.” […]”<

See on Scoop.itGreen & Sustainable News

Crude Oil Spills From Pipeline Into Yellowstone River, Montana

Residents have reportedly smelled and tasted oil in their drinking water downstream from the spill, and the city’s water plant has stopped drawing from the river.

Source: thinkprogress.org

>” […] On Saturday morning, a pipeline in Montana spilled up to 50,000 gallons of crude oil into the Yellowstone River, the pipeline’s operator confirmed Sunday night. […]

The 12-inch diameter steel pipe breached and spilled anywhere from 12,600 to 50,000 gallons of oil nine miles upriver from the town of Glendive, with an unknown amount of it spilling into the partially frozen river, according to a statement from Bridger Pipeline LLC. The company said the spill occurred at 10 a.m. and they “shut in” the flow of oil just before 11 a.m. — meaning that though the pipeline section could still empty itself of its contents, no new addition oil would flow into the spilled area.

“Oil has made it into the river,” Bridger spokesperson Bill Salvin confirmed to the AP on Monday. “We do not know how much at this point.” Observers spotted oil, some of which was trapped under the ice, up to 60 miles downstream from Glendive. Paul Peronard, the EPA’s on-scene coordinator, said crews were attempting to use booms to prevent the spill from spreading further but the ice on top of the river was forcing them to “hunt and peck” through it.  […]

“We think it was caught pretty quick, and it was shut down,” said Montana Governor Steve Bullock spokesperson Dave Parker, noting that the river was frozen over near the spill, which could help isolate the spill.

Parker told MTN News that “the Governor is committed to ensuring that the river is completely cleaned up and the folks responsible are held accountable.”

In 2011, an Exxon Mobil pipeline spilled 63,000 gallons of crude oil into the Yellowstone near Laurel, Montana. Days after the spill, goat rancher Alexis Bonogofsky was hospitalized for acute hydrocarbon exposure after noticing oil slicks along the riverbank abutting her ranch. She lived far enough downstream that any evacuation order missed her, she said. There was concern then that the cause of the spill was related to climate-change-influenced raging floodwaters that exposed the normally deeply-buried pipe to damaging debris.

Even two years later, the state was still fighting with Exxon over damages to the area from the spill and the clean-up process, leaving fish, birds, and wildlife dead or injured and interrupting environmental studies, recreation, and fishing.

Bridger’s pipeline runs from the Canadian border down through Montana across the Missouri and Yellowstone rivers and east into North Dakota, dubbed the Poplar System. It is on the opposite side of Wyoming from, and downstream of, Yellowstone National Park, but the river empties into the Missouri River.

The proposed — and controversial — northern leg of the Keystone XL pipeline would bethree times the diameter of the breached Bridger pipeline, and pump more than 34 million gallons of oil per day through the Dakotas down into Nebraska and into the southern leg in Oklahoma and Texas. Many landowners and local residents are concerned about what a potential spill would mean for critical watersheds and aquifers — not to mention what subsequent increased tar sands oil production means for Canadian watersheds.”<


See on Scoop.itGreen & Sustainable News

Energy Efficiency, the Invisible fuel

THE CHEAPEST AND cleanest energy choice of all is not to waste it. Progress on this has been striking yet the potential is still vast. Improvements in energy…

Source: www.economist.com

>”[…] The “fifth fuel”, as energy efficiency is sometimes called, is the cheapest of all. A report by ACEEE, an American energy-efficiency group, reckons that the average cost of saving a kilowatt hour is 2.8 cents; the typical retail cost of one in America is 10 cents. In the electricity-using sector, saving a kilowatt hour can cost as little as one-sixth of a cent, says Mr Lovins of Rocky Mountain Institute, so payback can be measured in months, not years.

The largest single chunk of final energy consumption, 31%, is in buildings, chiefly heating and cooling. Much of that is wasted, not least because in the past architects have paid little attention to details such as the design of pipework (long, narrow pipes with lots of right angles are far more wasteful than short, fat and straight ones). Energy efficiency has been nobody’s priority: it takes time and money that architects, builders, landlords and tenants would rather spend on other things.

In countries with no tradition of thrifty energy use, the skills needed are in short supply, too. Even the wealthy, knowledgeable and determined Mr Liebreich had trouble getting the builders who worked on his energy-saving house to take his instructions seriously. Painstakingly taping the joins in insulating boards, and the gaps around them, seems unnecessary unless you understand the physics behind it: it is plugging the last few leaks that brings the biggest benefits. Builders are trained to worry about adequate ventilation, but not many know about the marvels of heat exchangers set in chimney stacks. […]

One answer to this market failure is to bring in mandatory standards for landlords and those selling properties. Another involves energy-service companies, known as ESCOs, which guarantee lower bills in exchange for modernisation. The company can develop economies of scale and tap financial markets for the upfront costs. The savings are shared with owners and occupiers. ESCOs are already a $6.5 billion-a-year industry in America and a $12 billion one in China. Both are dwarfed by Europe, with €41 billion ($56 billion) last year. Navigant Research, the consultancy, expects this to double by 2023.

That highlights one of the biggest reasons for optimism about the future of energy. Capital markets, frozen into caution after the financial crash of 2008, are now doing again what they are supposed to do: financing investments on the basis of future revenues. The growth of a bond market to pay for energy-efficiency projects was an encouraging sign in 2014, when $30 billion-40 billion were issued; this year’s total is likely to be $100 billion.

“The price of fossil fuels will always fluctuate. Solar is bound to get cheaper”

Solar energy is now a predictable income stream drawing in serious money. A rooftop lease can finance an investment of $15,000-20,000 with monthly payments that are lower than the customer’s current utility bill. SolarCity, an American company, has financed $5 billion in new solar capacity, raising money initially from institutional investors, including Goldman Sachs and Google, but now from individual private investors—who also become what the company calls “brand ambassadors”, encouraging friends and colleagues to install solar panels too.

The model is simple: SolarCity pays for the installation, then bundles the revenues and sells a bond based on the expected future income stream. Maturities range from one to seven years. The upshot is that the cost of capital for the solar industry is 200-300 basis points lower than that for utilities. […]”<

See on Scoop.itGreen & Sustainable News

Continuous Monitoring Solution Designed for Facility and Energy Management

Verisae and Ecova partner to combine technology and service across nearly 3,000 facilities for an innovative and smart operational approach …


image source: http://energymanagementsystems.org/faqs-on-developing-energy-management-systems/

Source: www.virtual-strategy.com

>” Verisae, a leading global provider of SaaS solutions that drive cost reductions in maintenance, energy, mobile workforces, and environmental management, and Ecova, a total energy and sustainability management company, are pleased to announce the success of their growing partnership to help multisite companies solve their toughest energy, operations, and maintenance challenges.

The continuous monitoring solution combines Verisae’s Software-as-a-Service (SaaS) technology platform with Ecova’s Operations Control Center (OCC) to empower data-driven decision making. The solution analyses operational data in real-time, and has the capability to look for issues and anomalies to predict equipment failure and automatically identify inefficiencies causing higher energy consumption.

Ecova’s fully-staffed 24/7/365 OCC investigates inbound service calls, alarms, telemetry data, and work orders to determine the source of energy, equipment, and system faults and, where possible, corrects issues remotely before they escalate into financial, operational, or comfort problems. Trouble tickets and inbound calls are captured and tracked in the Verisae platform to provide companies with visibility into any operational issues. Combining data analytics that flag potentially troubling conditions with a service that investigates and resolves issues increases operational efficiencies and improves energy savings.

“Companies are constantly challenged to cut costs while maintaining quality, performance, and comfort,” says Jerry Dolinsky, CEO of Verisae. “Our combined solution helps clients address these challenges so they can reduce costs and improve operational efficiencies without impacting value.”

[…] “<

See on Scoop.itGreen Energy Technologies & Development

WTE Power Plant Saves 1.3 Million GPD of Water Daily with Tertiary Water Treatment & Recycling

Covanta’s Delaware Valley energy-from-waste facility in Chester, Pennsylvania, has saved 1.3 million gallons a day from local water supplies by installing Ge…

Source: www.environmentalleader.com

>” […] The Chester facility generates up to 90 megawatts of clean energy from 3,510 tons per day of municipal solid waste. Previously, the plant used 1.3 MGD — or nearly 5 million liters a day — of municipal drinking water in its waste conversion process, costing the company thousands of dollars in daily water purchases.

To reduce facility operating expenses and the consumption of local water resources, Covanta Delaware Valley upgraded the facility by installing GE’s RePAK combination ultrafiltration (UF) and reverse osmosis (RO) system as a tertiary treatment package. The new system enabled the plant to reuse 1.3 MGD of treated discharge water from a nearby municipal wastewater treatment plant for the facility’s cooling tower.

GE installed two RePAK-450 trains, each producing 450 gallons per minute of purified water. As a result, Covanta Delaware Valley has eliminated the need to purchase 1.3 MGD of local drinking water a day, which results in a substantial financial savings in addition to the environmental benefits.

GE’s RePAK equipment was delivered in 2014, with commissioning taking place the same year, making Covanta Delaware Valley the first North American company to deploy GE’s RePAK technology.

Covanta chose a combined water treatment technology approach because the typical organic and dissolved mineral content of the wastewater requires additional treatment to be suitable for use as cooling tower makeup. RO was selected as the technology of choice, and UF was required as the pretreatment solution.

GE’s RePAK combined treatment system reduces the equipment footprint up to 35 percent as compared to separate UF and RO systems. By combining the UF and RO into a common frame with common controls and GE’s single (patent-pending) multi-functional process tank, GE also is able to reduce the capital costs and field installation expenses when compared to the use of separate UF system and RO systems with multiple process and cleaning tanks, the company says.”<


See on Scoop.itGreen Energy Technologies & Development