Market Sentiment Analysis of Candlestick Charts

Author: Duane M. Tilden, P.Eng.                       Date: June 23, 2018

To become a successful trader in markets, such as cryptocurrency trading, one has to develop strategies which will give them the greatest probability of success, or for most, a profit.

How much risk and reward is up to every trader, as well as the selection of digital assets held and quantity. There are short, medium and long term goals and various methods of achieving each one of these objectives.

One tool that is very useful for developing short term trading strategies which can return a profit to the trader, is understanding Candlestick charts.

Figure 1: Anatomy of a Candlestick (1)

Anatomy of a candlestick

For reading and developing trading strategies, understanding the mechanics of a candlestick chart can lead to opportunities in trading assets to maximize ROI (return on investment), or to determine when to buy and sell assets.

How to Read a Single Candlestick (2)

Each candlestick represents one day’s worth of price data about a stock through four pieces of information: the opening price, the closing price, the high price, and the low price. The color of the central rectangle (called the real body) tells investors whether the opening price or the closing price was higher. A black or filled candlestick means the closing price for the period was less than the opening price; hence, it is bearish and indicates selling pressure. Meanwhile, a white or hollow candlestick means that the closing price was greater than the opening price. This is bullish and shows buying pressure. The lines at both ends of a candlestick are called shadows, and they show the entire range of price action for the day, from low to high. The upper shadow shows the stock’s highest price for the day and the lower shadow shows the lowest price for the day.

Bearish and Bullish Candlesticks

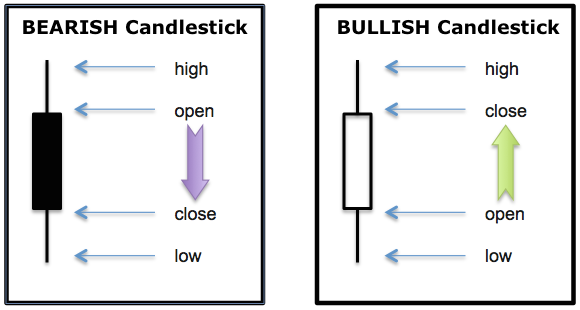
A candlestick represents the price activity of an asset during a specified timeframe through the use of four main components: the open, close, high and low.

The “open” of a candlestick represents the price of an asset when the trading period begins whereas the “close” represents the price when the period has concluded. The “high” and the “low” represent the highest and lowest prices achieved during the same trading session.

There is much more to reading and understanding candlestick charts than is covered here. This brief has informational links to where more information on patterns and indicators, and advice on how to use these patterns to make decisions in trading.

Bottom Line (2):

Investors should use candlestick charts like any other technical analysis tool (i.e., to study the psychology of market participants in the context of stock trading). They provide an extra layer of analysis on top of the fundamental analysis that forms the basis for trading decisions. We looked at five of the more popular candlestick chart patterns that signal buying opportunities. They can help identify a change in trader sentiment where buyer pressure overcomes seller pressure. Such a downtrend reversal can be accompanied by a potential for long gains. That said, the patterns themselves do not guarantee that the trend will reverse. Investors should always confirm reversal by the subsequent price action before initiating a trade. (Read more in Candlestick Charting: Perfecting The Art)

References:

  1. crypto-trading-101-beginners-guide-candlesticks/
  2. using-bullish-candlestick-patterns-buy-stocks
Advertisement

Microgrids and the Blockchain – Transforming the Energy Supply

Author: Duane M. Tilden, P.Eng.           Date: June 10, 2018

In the transition from the centralized utility is the development of the Micro-grid.  The Micro-grid offers many benefits to society, including; (a) use of renewable energy sources that reduce or eliminate the production of GHG’s, (b) increases in energy efficiency of energy transmission due to shortening of transmission distances and infrastructure, (c) improved municipal resilience against disaster and power reductions, and finally, (d) promotion of economic activity that improves universal standard of living. (1)

The Brooklyn Microgrid Experiment

A Network of Energy Cells (2)

In order to be successful, blockchain platforms and microgrids require a regulatory framework. In New York State, such a framework is provided by “Reforming the Energy Vision” (REV). The platform’s objectives are to minimize the vulnerability of the power supply system that became visible during Hurricane Sandy, to use more sources of renewable energy, and to reduce costs.

The Brooklyn Microgrid is a good test case for these objectives. “A microgrid is a nucleus that sets the stage for an energy future consisting of networks of energy cells,” says Stefan Jessenberger from Siemens’ Energy Management Division. “Blockchain also supports this process, because it makes it much easier to conduct energy trading within cells.”

Siemens Digital Grid, next47, and LO3 Energy all believe in the potential of blockchain-based microgrids, because this technology can be used wherever there are decentralized energy sources. “Our experiences with the Brooklyn Microgrid will certainly flow into future projects,” says Kessler.

 
Image #1: A Canal in Brooklyn, New York (5)

The Future is Now

But something else is happening to the grid as energy generation changes – the rise of microgrids. These smaller grid systems are linked to localised power sources, often referred to as “distributed generation” sources. For example, a handful of buildings in a city with their own solar panels might be connected to nearby residences.

In fact, that is exactly the model that LO3 Energy has experimented with in its Brooklyn Microgrid project. Customers signed up to it can choose to power their homes via a range of local renewable energy sources. People with their own solar panels can sell surplus electricity to their neighbours, for example. It’s a peer-to-peer network for electricity.

To ensure that accurate records of these transactions are kept, LO3 has opted to use blockchain distributed ledger technology. This means the microgrid’s accounting is decentralised and shared by everyone on the network.

“It’s virtually unhackable,” says founder and chief executive Lawrence Orsini, explaining that tampering with these records is almost impossible because of the fact that everyone has their own, regularly updated copy of the ledger.

LO3 is now rapidly expanding with a series of other projects around the world. One is based in South Australia, where Orsini explains there is already a lot of distributed generation going on – and plenty of grid stability issues. Users can now experiment with LO3 to get access to electricity from solar-fuelled batteries nearby when needed. (3)

Physical and Virtual Microgrids

Challenging the traditional electrical supply model are microgrids. The “microgrid” term normally refers to a localised grid that can disconnect from the main grid and operate autonomously. It uses local sources of energy to serve local users, integrating the supply of energy from various producers, including local power generators and providers of renewable energy such as solar power. Consumers with their own energy production capabilities (wind turbines or solar energy systems) can sell their surplus energy production back to peers in the microgrid, on a pay-per-use basis (becoming ‘prosumers’).

While physical microgrids are still rare, we do observe the development of virtual microgrids using peer-to-peer energy trading. Blockchain is just one element in the transformation of electricity supply, providing Distributed Ledger Technology (DLT) to members of a peer-to-peer energy network, or microgrid. It offers [or ‘provides’] a reliable, lower-cost digital platform for making, validating, recording and settling energy transactions in real time across a localised and decentralised energy system.

With increasing demand for more flexible energy supplies we expect a continued increase in the number of virtual microgrids and a gradual movement towards true, physical microgrids along 4 stages […] (4)

“This project…, is the first version of a new kind of energy market, operated by consumers, which will change the way we generate and consume electricity.”
New Scientist (5)

References:  

  1. microgrid-as-a-service-maas-and-the-blockchain/
  2. smart-grids-and-energy-storage-microgrid-in-brooklyn
  3. http://www.wired.co.uk/article/microgrids-wired-energy
  4. energy-and-resources/articles/will-microgrids-transform-the-marke.html
  5. http://brooklynmicrogrid.com/

Game Theory and Markets: Schelling Points and The Nash Equilibrium

Author: Duane M. Tilden, P.Eng.        Date: June 10, 2018

Prologue:  It’s been a few weeks since my last blog post as I have been quite involved in other matters. As part of my work involves research and learning I would like to organize some of my discoveries and thoughts and relate them further by curation and publication on my blog.

Some things that I have been aware of it seems to me, intuitively, are rules which have been previously codified by others. Two now under examination are named after their discoverer’s respectively; Schelling Points and The Nash Equilibrium.  These ideas have profound implications in various forms of trade, microeconomics, macroeconomics, and cryptoeconomics.

Schelling or “Focal” Points

In the study of crowds or markets as an example we will find that there will be a tendency of people to gravitate towards the familiar in the absence of information. Such information is useful in the study of how people tend to behave. This information can also used to make optimal choices between two or more people in games of strategy whether between strangers where the others’ choice is unknown, or between friends or groups who may be more predictable in behaviour.

Image result for grand central station new yorkImage 1:  Grand Central Terminal turned 100 years old in 2013. Photo: Buck Ennis

In my own study of markets and their behaviour it is noticeable that one can postulate certain cycles based on common patterns where conflicts for disposable income can affect the movement of capital in and out of the market. I find that this is very similar to what has been found by Thomas Schelling and is also known as “focal points”.

Image result for thomas schellingImage 2: Thomas Schelling received his Ph.D. from Harvard in 1946 and joined the Harvard faculty in 1958. Photo by Martha Stewart

Thomas Schelling, the Nobel-winning game theorist … found in an informal survey that many of his students tended toward the same answer when posed this question about New York City: they would wait under the clock in Grand Central Station at 12 noon, hoping their partners had the same idea.

He introduced this concept in his 1960 book The Strategy of Conflict as a “focal point” – a solution to a coordination problem that somehow stands out as the natural answer even if the participants don’t have a chance to arrange it beforehand. Schelling argued that people’s apparent ability to coordinate without communicating was key to understanding how real-life strategic games are solved.

As game theory has developed in the decades since, Schelling’s ideas about focal points have been rarely studied, partly because the existence of focal points was perceived more as a mysterious, sociological phenomenon rather than an economic one amenable to analysis.

Schelling argued that people’s apparent ability to coordinate without communicating was key to understanding how real-life strategic games are solved.

Schelling himself said trying to determine the focal point of a game analytically is like trying to use a computer to understand whether a joke will be funny – it depends on cultural context and the relationship of the people trying to coordinate. Even the classic Schelling focal point of Grand Central might not apply if you asked different groups of New Yorkers who lived in different parts of the city or never took the trains that pass through the station.

The Nash Equilibrium

The Nash Equilibrium is a basic solution set which can be identified in every day life through some observation. One of the better examples it the driver matrix on a two-way street, where the optimal solution is for both drivers to drive on the left hand or right hand side of the road. If not, then a collision will likely result as both cars will be moving in opposing directions head-on.

Generally speaking one can view this equilibrium as an expectation that in various scenario’s where a choice is required, the person will behave in their own best interests. Understanding this concept is essential to how incentives work in an economy and how such incentives can be used to modify a person’s behavior, whether in a game, company, group, or a market.

Nash Equilibrium is a term used in game theory to describe an equilibrium where each player’s strategy is optimal given the strategies of all other players. A Nash Equilibrium exists when there is no unilateral profitable deviation from any of the players involved. In other words, no player in the game would take a different action as long as every other player remains the same. Nash Equilibria are self-enforcing; when players are at a Nash Equilibrium they have no desire to move because they will be worse off.