Energy Certificates and the Blockchain Protocol

In the world of energy production, renewable energy sources, micro grids, large scale users, and other forms of electric power schemes there is a concentrated effort being placed on utilizing the Blockchain protocol.  This is because of the unique way in which a unit may be defined and tracked, similarly, can be associated to tracking quantities of value created and utilized in a complex trading scheme.

In a recent article (1) it has been reported that Jesse Morris, principal for electricity and transportation practices at RMI and co-founder of the Energy Web Foundation (EWF) received $2.5 million to develop the Blockchain protocol for energy purposes.

“We have a strong hypothesis that blockchain will solve a lot of long-running problems in the energy sector,” said Morris. “Overcoming these challenges could make small, incremental changes to energy infrastructure and markets in the near term, while others would be more far-reaching and disruptive.”

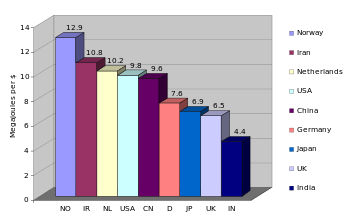
Certificates (also known as guarantees) of origin would assure the user that a particular megawatt-hour of electricity was produced from renewables. According to Morris, the U.S. alone has 10 different tracking systems, Asia-Pacific has several more, and each European country has its own system of certification. Blockchain could be used to transparently guarantee the origin of the electrons.

Longer-term, and more radically, RMI sees the future of electricity networks being driven by the billions of energy storage and HVAC units, EVs, solar roof panels and other devices and appliances at the grid edge.

Blockchains can allow any of them to set their own level of participation on the grid, without the need for an intermediary. And crucially, they can be configured so that if a grid operator needs guaranteed capacity, the grid-edge unit can communicate back to the grid whether or not it’s up to the task.

This is an example of what Morris described as blockchain’s ability to “fuse the physical with the virtual” via machine-to-machine communication.  (1)

Another example of the emergence of the usefulness and interest in the Blockchain protocol is in crowdsourcing and distributed ledger applications.

Illustration by Dan Page (2)

At its heart, blockchain is a self-sustaining, peer-to-peer database technology for managing and recording transactions with no central bank or clearinghouse involvement. Because blockchain verification is handled through algorithms and consensus among multiple computers, the system is presumed immune to tampering, fraud, or political control. It is designed to protect against domination of the network by any single computer or group of computers. Participants are relatively anonymous, identified only by pseudonyms, and every transaction can be relied upon. Moreover, because every core transaction is processed just once, in one shared electronic ledger, blockchain reduces the redundancy and delays that exist in today’s banking system.

Companies expressing interest in blockchain include HP, Microsoft, IBM, and Intel. In the financial-services sector, some large firms are forging partnerships with technology-focused startups to explore possibilities. For example, R3, a financial technology firm, announced in October 2015 that 25 banks had joined its consortium, which is attempting to develop a common crypto-technology-based platform. Participants include such influential banks as Citi, Bank of America, HSBC, Deutsche Bank, Morgan Stanley, UniCredit, Société Générale, Mitsubishi UFG Financial Group, National Australia Bank, and the Royal Bank of Canada. Another early experimenter is Nasdaq, whose CEO, Robert Greifeld, introduced Nasdaq Linq, a blockchain-based digital ledger for transferring shares of privately held companies, also in October 2015. (2)


References:

  1. Energy Companies look to Blockchain
  2. A Strategist’s Guide to the Blockchain
Advertisement

Benchmarking Buildings by Energy Use Intensity (EUI)

There are many metrics and measurements when it comes to evaluating energy as we use it in our daily lives.  In order to compare between different sources or end uses we often have to make conversions in our terms so that our comparisons are equitable.  This may be further complicated as different countries often use different standards of measure, however, we will convert to common units.

Benchmarking

Benchmarking is the practice of comparing the measured performance of a device, process, facility, or organization to itself, its peers, or established norms, with the goal of informing and motivating performance improvement. When applied to building energy use, benchmarking serves as a mechanism to measure energy performance of a single building over time, relative to other similar buildings, or to modeled simulations of a reference building built to a specific standard (such as an energy code). (1)

Benchmarking is a common practice in buildings to establish existing consumption rates and to identify areas that require improvement and to help prioritize improvement projects.  These benchmarks can be established for a building, system within a building, or even a larger campus, facility or power source.  Usually an energy or facility manager will determine energy consumption over a fixed period of time, 1 to 3 years, and compare it to similar facilities.  Normalized by gross square footage of the building the EUI is usually expressed as kBtu/sf per year.

Energy Intensity (EI) of a Country

Figure 1:  Energy Intensity of different economies The graph shows the amount of energy it takes to produce a US $ of GNP for selected countries. (2)

Not to be confused with Energy Use Intensity, Energy Intensity is an economic measure of energy use normalized by the GDP of a country and is considered a measure of a Nation’s Energy Efficiency.  Countries with a high EI have a higher cost to convert energy into GDP, whereas countries with low EI have lower costs of converting energy into GDP.  Many factors contribute to the EI value, including climate, energy sources and  economic productivity. (2)

Energy Use Intensity (EUI)

The EUI of a building includes the electrical power use and heating fuel consumption for heating and hot water generation.  Many facilities require different loads according to their primary use or function, including cooling and refrigeration.  For the comfort of occupants electricity is needed for lighting and plug loads to meet the functioning needs of the equipment in the facility.  Heating, ventilation and air conditioning (HVAC) may require electricity or another fuel such as natural gas.  Hot water may be generated with electricity or a fuel.  A site may also have solar PV or hot water, wind power, and daylighting programs.  There are also many strategies which may be employed by building operators to reduce loads and energy consumption including controls, storage, micro-grid, purchasing offsets, etc.

When comparing buildings, people not only talk about total energy demands, but also talk about “energy use intensity” (EUI).  Energy intensiveness is simply energy demand per unit area of the building’s floorplan, usually in square meters or square feet. This allows you to compare the energy demand of buildings that are different sizes, so you can see which performs better.

EUI is a particularly useful metric for setting energy use benchmarks and goals. The EUI usually varies quite a bit based on the building program, the climate, and the building size. (3)

Image result

Figure 2.  Typical EUI for selected buildings.  This graph is based on research EPA conducted on more than 100,000 buildings (4)

Site Energy vs Source Energy

As we go forward into the future, it is rather unclear how current events will affect the international agreements on reducing carbon consumption.  However, generally speaking, renewable energy sources are seen to becoming more economic for power production.  For many facilities this means that supplementing existing grid sources for power with on-site power production is making economic sense.  Future building improvements may include sub-systems, batteries and energy storage schemes, renewable sources or automated or advanced control systems to reduce reliance on grid sourced power.

The energy intensity values in the tables above only consider the amount of electricity and fuel that are used on-site (“secondary” or “site” energy). They do not consider the fuel consumed to generate that heat or electricity. Many building codes and some tabulations of EUI attempt to capture the total impact of delivering energy to a building by defining the term  “primary” or “source” energy which includes the fuel used to generate power on-site or at a power plant far away.

When measuring energy used to provide thermal or visual comfort, site energy is the most useful measurement. But when measuring total energy usage to determine environmental impacts, the source energy is the more accurate measurement.

Sometimes low on-site energy use actually causes more energy use upstream.  For example, 2 kWh of natural gas burned on-site for heat might seem worse than 1 kWh of electricity used on-site to provide the same heating with a heat pump.  However, 1 kWh of site electricity from the average US electrical grid is equal to 3.3 kWh of source energy, because of inefficiencies in power plants that burn fuel for electricity, and because of small losses in transmission lines.  So in fact the 2 kWh of natural gas burned on site is better for heating. The table below provides the conversion factors assumed by the US Environmental Protection Agency for converting between site and source energy. (3)

References:

(1) BUILDING ENERGY USE BENCHMARKING  https://energy.gov/eere/slsc/building-energy-use-benchmarking

(2) ENERGY INTENSITY  https://en.wikipedia.org/wiki/Energy_intensity

(3) MEASURING BUILDING ENERGY USE  https://sustainabilityworkshop.autodesk.com/buildings/measuring-building-energy-use

(4) WHAT IS ENERGY USE INTENSITY (EUI)?  https://www.energystar.gov/buildings/facility-owners-and-managers/existing-buildings/use-portfolio-manager/understand-metrics/what-energy

Mass Transit Prioritized in US Election – $200 Billion Approved by Voters

As gridlock continues to be a problem in the United States, exacerbated by crumbling infrastructure, the American public has reportedly approved up to $200 billion for rapid and mass transit.

According to the American Public Transportation Association (Apta), the 49 ballot measures totalling nearly $US 200bn that were voted on were the largest in history.  […]

The largest measure in the country, Los Angeles County’s Measure M, was passed with 69% approval with all precincts reporting. The sales tax increase needed a two-thirds majority to pass and is expected to raise $US 120bn over 40 years to help fund transport improvement projects, including Los Angeles County Metropolitan Transportation Authority (LACMTA) schemes to connect Los Angeles International Airport to LACMTA’s Green Line, Crenshaw/LAX line and bus services; extend the Purple Line metro to Westwood; extend the Gold Line 11.7km; extend the Crenshaw Line north to West Hollywood; and build a 6.1km downtown light rail line. The measure will also provide $US 29.9bn towards rail and bus operations, and $US 1.9bn for regional rail.

California’s other big transit wins include Measure RR in the San Francisco Bay area, which will authorise $US 3.5bn in bonds for Bay Area Rapid Transit rehabilitation and modernisation. It required a cumulative two-thirds vote in San Francisco, Alameda and Contra Costa counties for passage and received 70% approval. (1)

Image result for BART train

Figure 1.  Bay Area Rapid Transit (2)


BART’s Focus on Material Conservation, Energy Savings and Sustainability

BART’s infrastructure requires the train cars to be extremely lightweight. To meet this requirement, most of the exterior of the new train cars will be constructed out of aluminum. Aluminum is abundant, doesn’t rust, and when properly finished, reflects heat and light, keeping the train cars cool. It is lightweight but strong, yet fairly easy to work with, reducing the energy investment during the manufacturing process. Additionally, aluminum is easily and readily recyclable, making it very low impact when the train cars are eventually retired and dismantled.  (2)

Federal Investment in Rapid Transit and Transportation Infrastructure Lagging

Yet, despite the public’s continued desire to see greater investment in transit, historically transit has received only a small minority of funding at the federal level. Currently, only 20 percent of available federal transportation funds are invested in transit and just 1 percent of funds are invested in biking and walking infrastructure. Meanwhile, 80 percent of federal transportation dollars continue to be spent on roads.

“While many localities recognize the need to invest in transit, biking, and pedestrian solutions that can bring our transportation system into the 21st century, federal officials remain woefully behind the curve,” said Olivieri. “While it is great to see such widespread support of transit at the local level, the need for these measures speaks volumes about how out of sync federal decision makers are with the wants and needs of the American people,” he added.

The nation currently faces an $86 billion transit maintenance repair backlog, while data from the Federal Highway Administration’s National Bridge Inventory show that despite the large discrepancy at the federal level between investment in transit and spending on roads, the nation’s road system is in similarly bad shape. To date, more than 58,000 bridges remain structurally deficient.

“Despite the fact that roads receive 80 percent of available federal transportation dollars, both transit and roads continue to face enormous repair and maintenance backlogs,” said Lauren Aragon, Transportation Fellow at U.S. PIRG. “While the overall level of funding is important, how states spend the limited federal funding they receive can have even greater consequences but states continue to funnel road funding into new and wider highway projects, leaving the existing system to crumble. We need to fix what we have already built first,” she added.  (3)

MAY15_11_000001667330

Figure 2. Typical image of steel bridge in disrepair (4)


Harvard Business Review Reports on Crumbling American Infrastructure

Bridges are crumbling, buses are past their prime, roads badly need repair, airports look shabby, trains can’t reach high speeds, and traffic congestion plagues every city. How could an advanced country, once the model for the world’s most modern transportation innovations, slip so badly?

The glory years were decades ago. Since then, other countries surpassed the U.S. in ease of getting around, which has implications for businesses and quality of life. For example, Japan just celebrated the 50thanniversary of its famed bullet train network, the Shinkansen. Those trains routinely operate at speeds of 150 to 200 miles per hour, and in 2012, the average deviation from schedule was a miniscule 36 seconds. Fifty years later, the U.S. doesn’t have anything like that. Amtrak’s “high-speed” Acela between Washington, D.C., and Boston can get up to full speed of 150 mph only for a short stretch in Rhode Island and Massachusetts, because it is plagued by curves in tracks laid over a century ago and aging components, such as some electric overhead wiring dating to the early 1900s.

Numerous problems plague businesses and consumers: Goods are delayed at clogged ports. Delayed or cancelled flights cost the U.S. economy an estimated $30-40 billion per year – not to mention ill will of disgruntled passengers. The average American wastes 38 hours a year stuck in traffic. This amounts to 5.5 billion hours in lost U.S. productivity annually, 2.9 gallons of wasted fuel, and a public health cost of pollution of about $15 billion per year, according to Harvard School of Public Health researchers. The average family of four spends as much as 19% of its household budget on transportation. But inequality also kicks in: the poor can’t afford cars, yet are concentrated in places without access to public transportation. To top it all, federal funding for highways, with a portion for mass transit, is about to run out.  (4)


References:

(1)  Nearly 70% of US transit ballot measures pass;  http://www.railjournal.com/index.php/north-america/nearly-70-of-us-transit-ballot-measures-pass.html

(2)  BART – New Train Car Project;  http://www.bart.gov/about/projects/cars/sustainability

(3)  BILLIONS IN TRANSIT BALLOT INITIATIVES GET GREEN LIGHT;  http://www.uspirg.org/news/usp/billions-transit-ballot-initiatives-get-green-light

(4)  What It Will Take to Fix America’s Crumbling Infrastructure;  https://hbr.org/2015/05/what-it-will-take-to-fix-americas-crumbling-infrastructure

US Utilities #1 Priority is to Replace and Modernize Old Grid Infrastructure

The State of the Electric Utility 2015 survey revealed that aging infrastructure is what troubles industry players most.

Source: www.utilitydive.com

>” Utility executives identified aging infrastructure as the number one challenge facing the electric industry, […] easily topping an aging workforce, regulatory models and stagnant load growth. In response, the industry is spending hundreds of billions to replace and upgrade infrastructure, rushing to meet consumer demand for higher quality power enabled by construction of a more modern grid.

“The last few years there’s been more of an emphasis on transmission and distribution, and the driver there has been the advent of all these new technologies that are trying to connect with the grid,” said Richard McMahon, Jr., vice president of energy supply and finance for the Edison Electric Institute, the electric utility trade organization. “There are also a lot of customer-driven desires utilities are trying to facilitate. There’s a lot of spending on metering automation, as well as at the distribution level, distribution transformers to accommodate distributed generation.”

Today’s grid may not be up to the task of reliably integrating high levels of renewables, distributed energy resources, and smart grid technologies, Utility Dive found. The American Society of Civil Engineers (ASCE) gave U.S. energy infrastructure a barely passing grade of D+ in 2013, at stark odds with the sophisticated grid management required by the rapid acceleration of utility-scale renewables, distributed resources and two-way devices.

“Distributed energy cannot be a profit center without the modernized grid infrastructure that’s needed for grid integration,” Utility Dive concluded in the report. […]

Outages on the rise

The American Society of Civil Engineers report that gave U.S. infrastructure a barely-passing grade pointed out that aging equipment “has resulted in an increasing number of intermittent power disruptions, as well as vulnerability to cyber attacks.”

Significant power outages rose to more than 300 in 2011, up from about 75 in 2007, and the report found many transmission and distribution outages have been attributed to system operations failures, though from 2007 to 2012 water was the primary cause of major outages.

“While 2011 had more weather-related events that disrupted power, overall there was a slightly improved performance from the previous years,” the report said. “Reliability issues are also emerging due to the complex process of rotating in new energy sources and ‘retiring’ older infrastructure.

ASCE said that for now, the United States has sufficient capacity to meet demands, but from 2011 through 2020 demand for electricity in all regions is expected to increase 8% or 9%. The report forecasts that the U.S. will add 108 GW of generation by 2016.

“After 2020, capacity expansion is forecast to be a greater problem, particularly with regard to generation, regardless of the energy resource mix,” the report said. “Excess capacity, known as planning reserve margin, is expected to decline in a majority of regions, and generation supply could dip below resource requirements by 2040 in every area except the Southwest without prudent investments.” […]”<

See on Scoop.itGreen & Sustainable News

New York to Retrofit 250,000 Streetlights With Energy-Saving LED Bulbs

See on Scoop.itGreen Energy Technologies & Development

The phaseout is part of a long-term plan to reduce greenhouse gas emissions by 30 percent by 2017 and, Mayor Michael R. Bloomberg said, would save taxpayers money.

Duane Tilden‘s insight:

>The news conference was on Eastern Parkway in Brooklyn, where lights have already been replaced, expecting to save more than $70,000 and nearly 248,000 kilowatt-hours a year in energy. Unlike standard lights, which last six years, LED bulbs can burn for 20 years before they need to be replaced, the administration said, and the project is expected to save $14 million a year in energy and maintenance costs. […]

“People tend to like them,” she said. “It’s clear. It’s bright. It really does a good job in providing fresher light.” The project is estimated to cost $76.5 million.

The project is the first to receive financing through the Accelerated Conservation and Efficiency initiative or “ACE,” the administration said, a $100 million competitive program that the Department of Citywide Administrative Services created to expedite such sustainability projects.<

See on www.nytimes.com

Climate Change Will Cause More Energy Breakdowns, U.S. Warns

See on Scoop.itGreen & Sustainable News

The national power supply is increasingly vulnerable to severe weather, according to a new Department of Energy study.

Duane Tilden‘s insight:

>The effects are already being felt, the report says. Power plants are shutting down or reducing output because of a shortage of cooling water. Barges carrying coal and oil are being delayed by low water levels in major waterways. Floods and storm surges are inundating ports, refineries, pipelines and rail yards. Powerful windstorms and raging wildfires are felling transformers and transmission lines.

“We don’t have a robust energy system, and the costs are significant,” said Jonathan Pershing, the deputy assistant secretary of energy for climate change policy and technology, who oversaw production of the report. “The cost today is measured in the billions. Over the coming decades, it will be in the trillions. You can’t just put your head in the sand anymore.”<

See on www.nytimes.com