There are many metrics and measurements when it comes to evaluating energy as we use it in our daily lives. In order to compare between different sources or end uses we often have to make conversions in our terms so that our comparisons are equitable. This may be further complicated as different countries often use different standards of measure, however, we will convert to common units.
Benchmarking
Benchmarking is the practice of comparing the measured performance of a device, process, facility, or organization to itself, its peers, or established norms, with the goal of informing and motivating performance improvement. When applied to building energy use, benchmarking serves as a mechanism to measure energy performance of a single building over time, relative to other similar buildings, or to modeled simulations of a reference building built to a specific standard (such as an energy code). (1)
Benchmarking is a common practice in buildings to establish existing consumption rates and to identify areas that require improvement and to help prioritize improvement projects. These benchmarks can be established for a building, system within a building, or even a larger campus, facility or power source. Usually an energy or facility manager will determine energy consumption over a fixed period of time, 1 to 3 years, and compare it to similar facilities. Normalized by gross square footage of the building the EUI is usually expressed as kBtu/sf per year.
Energy Intensity (EI) of a Country
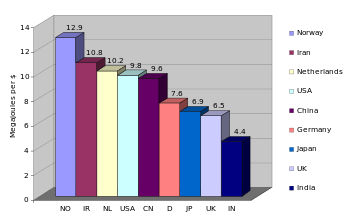
Figure 1: Energy Intensity of different economies The graph shows the amount of energy it takes to produce a US $ of GNP for selected countries. (2)
Not to be confused with Energy Use Intensity, Energy Intensity is an economic measure of energy use normalized by the GDP of a country and is considered a measure of a Nation’s Energy Efficiency. Countries with a high EI have a higher cost to convert energy into GDP, whereas countries with low EI have lower costs of converting energy into GDP. Many factors contribute to the EI value, including climate, energy sources and economic productivity. (2)
Energy Use Intensity (EUI)
The EUI of a building includes the electrical power use and heating fuel consumption for heating and hot water generation. Many facilities require different loads according to their primary use or function, including cooling and refrigeration. For the comfort of occupants electricity is needed for lighting and plug loads to meet the functioning needs of the equipment in the facility. Heating, ventilation and air conditioning (HVAC) may require electricity or another fuel such as natural gas. Hot water may be generated with electricity or a fuel. A site may also have solar PV or hot water, wind power, and daylighting programs. There are also many strategies which may be employed by building operators to reduce loads and energy consumption including controls, storage, micro-grid, purchasing offsets, etc.
When comparing buildings, people not only talk about total energy demands, but also talk about “energy use intensity” (EUI). Energy intensiveness is simply energy demand per unit area of the building’s floorplan, usually in square meters or square feet. This allows you to compare the energy demand of buildings that are different sizes, so you can see which performs better.
EUI is a particularly useful metric for setting energy use benchmarks and goals. The EUI usually varies quite a bit based on the building program, the climate, and the building size. (3)
_1.png)
Figure 2. Typical EUI for selected buildings. This graph is based on research EPA conducted on more than 100,000 buildings (4)
Site Energy vs Source Energy
As we go forward into the future, it is rather unclear how current events will affect the international agreements on reducing carbon consumption. However, generally speaking, renewable energy sources are seen to becoming more economic for power production. For many facilities this means that supplementing existing grid sources for power with on-site power production is making economic sense. Future building improvements may include sub-systems, batteries and energy storage schemes, renewable sources or automated or advanced control systems to reduce reliance on grid sourced power.
The energy intensity values in the tables above only consider the amount of electricity and fuel that are used on-site (“secondary” or “site” energy). They do not consider the fuel consumed to generate that heat or electricity. Many building codes and some tabulations of EUI attempt to capture the total impact of delivering energy to a building by defining the term “primary” or “source” energy which includes the fuel used to generate power on-site or at a power plant far away.
When measuring energy used to provide thermal or visual comfort, site energy is the most useful measurement. But when measuring total energy usage to determine environmental impacts, the source energy is the more accurate measurement.
Sometimes low on-site energy use actually causes more energy use upstream. For example, 2 kWh of natural gas burned on-site for heat might seem worse than 1 kWh of electricity used on-site to provide the same heating with a heat pump. However, 1 kWh of site electricity from the average US electrical grid is equal to 3.3 kWh of source energy, because of inefficiencies in power plants that burn fuel for electricity, and because of small losses in transmission lines. So in fact the 2 kWh of natural gas burned on site is better for heating. The table below provides the conversion factors assumed by the US Environmental Protection Agency for converting between site and source energy. (3)

References:
(1) BUILDING ENERGY USE BENCHMARKING https://energy.gov/eere/slsc/building-energy-use-benchmarking
(2) ENERGY INTENSITY https://en.wikipedia.org/wiki/Energy_intensity
(3) MEASURING BUILDING ENERGY USE https://sustainabilityworkshop.autodesk.com/buildings/measuring-building-energy-use
(4) WHAT IS ENERGY USE INTENSITY (EUI)? https://www.energystar.gov/buildings/facility-owners-and-managers/existing-buildings/use-portfolio-manager/understand-metrics/what-energy
