In the beginning, the Master Economist created the Economy. He created businesses large and small, consumers, governments with their regulation, and financial institutions of all types. And the Ma…

Source: How Energy Shapes the Economy
In the beginning, the Master Economist created the Economy. He created businesses large and small, consumers, governments with their regulation, and financial institutions of all types. And the Ma…
Source: How Energy Shapes the Economy
The need for large scale storage solutions come to the forefront as a means to adjust supply to demand on the electrical grid. Energy storage systems can adjust time of delivery to eliminate the need for peaker plants, allow for the addition of intermittent renewable energy sources such as wind and solar, or allow for large users to reduce facility operating costs by using a storage system to supplement energy supply reducing peak demand, most notably for summer A/C loads in buildings.

Out of engineering research laboratories in materials science and electro-chemistry are coming new energy storage systems designed for the future to solve these issues meanwhile opening up new enterprises and industry. The characteristics of an ideal flow battery would include: a long service life, modularity and scalability, no standby losses, chargeability, low maintenance, and safe. In addition a flow battery will have to be economic compared to other systems which will need to be determined using LCOE analysis.
Related Articles:
Links:
To begin, let us ask what is energy efficiency, what are it’s components and how is it measured. To make comparisons we need to gather data using measures relevant to the industry in question, also to the input forms of energy, waste streams and the useful work performed. In the case of a building we may use meters to measure consumption or utility bills and compare changes in consumption rates over time.
To an engineer, energy efficiency is the ratio of useful work over total energy input. For example, a room air conditioner’s efficiency is measured by the energy efficiency ratio (EER). The EER is the ratio of the cooling capacity (in British thermal units [Btu] per hour) to the power input (in watts).
On a grander scale we may be looking improvements over an industry or sector, changing fuel types in a utility such as the conversion of a coal plant to the production of power fueled by natural gas to reduce the carbon load on the environment. Efficiency may be measured by different metrics depending on the result sought and may include the environmental impact of waste streams.
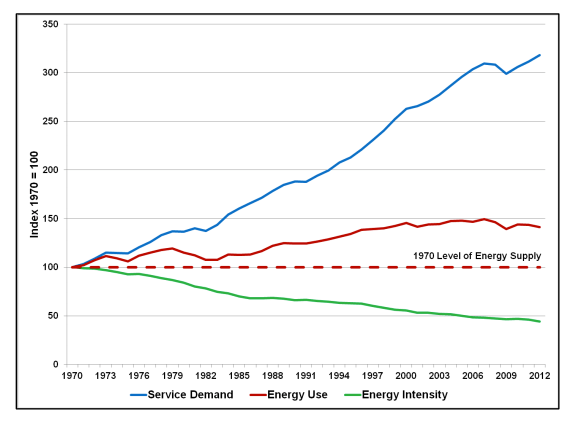
Figure 1: Historical Energy Use Graph (1)
Whatever the exact yearly investment figure, the historical economic impact of efficiency is quite clear. As the graph () shows, efficiency has provided three times more of the economic services than new production since 1970:
The blue line illustrates demand for energy services (the economic activity associated with energy use) since 1970; the solid red line shows energy use; and the green line illustrates the gain in energy efficiency. While demand for energy services has tripled in the last four decades, actual energy consumption has only grown by 40 percent. Meanwhile, the energy intensity of our economy has fallen by half.
The area between the solid red line and the blue line represents the amount of energy we did not need to consume since 1970; the area between the dashed red line and the solid red line indicates how much energy we consumed since 1970.
The chart shows that energy efficiency met nearly three quarters of the demand for services, while energy supply met only one quarter.
“One immediate conclusion from this assessment is that the productivity of our economy may be more directly tied to greater levels of energy efficiency rather than a continued mining and drilling for new energy resources,” wrote Laitner. (1)
As noted in an article by the EIA; The central question in the measurement of energy efficiency may really be “efficient with respect to what?” (2) In general terms when discussing energy efficiency improvements we mean to perform more of a function with the same or less energy or material input.
Energy efficiency measures are those improvement opportunities which exist in a system which when taken will achieve the goals of achieving greater performance. For example refer to Table 1 of Energy Efficiency Measures which can be effectively reduce energy consumption and provide an ROI of 5 or less years when applied to the commercial refrigeration industry.

Table 1: Commercial Refrigeration Energy Efficiency Measures (3)
Energy efficiency has been put forward as one of the most effective methods in efforts to address the issue of Climate Change. Recently, on February 19, 2015, President Obama signed Executive Order (EO) 13693.
“Since the Federal Government is the single largest consumer of energy in the Nation, Federal emissions reductions will have broad impacts. The goals of EO 13693 build on the strong progress made by Federal agencies during the first six years of the Administration under President Obama’s 2009 Executive Order on Federal Leadership on Environmental, Energy and Economic Performance, including reducing Federal GHG emissions by 17 percent — which helped Federal agencies avoid $1.8 billion in cumulative energy costs — and increasing the share of renewable energy consumption to 9 percent.
With a footprint that includes 360,000 buildings, 650,000 fleet vehicles, and $445 billion spent annually on goods and services, the Federal Government’s actions to reduce pollution, support renewable energy, and operate more efficiently can make a significant impact on national emissions. This EO builds on the Federal Government’s significant progress in reducing emissions to drive further sustainability actions through the next decade. In addition to cutting emissions and increasing the use of renewable energy, the Executive Order outlines a number of additional measures to make the Federal Government’s operations more sustainable, efficient and energy-secure while saving taxpayer dollars. Specifically, the Executive Order directs Federal agencies to:
– Ensure 25 percent of their total energy (electric and thermal) consumption is from clean energy sources by 2025.
– Reduce energy use in Federal buildings by 2.5 percent per year between 2015 and 2025.
– Reduce per-mile GHG emissions from Federal fleets by 30 percent from 2014 levels by 2025, and increase the percentage of zero emission and plug in hybrid vehicles in Federal fleets.
– Reduce water intensity in Federal buildings by 2 percent per year through 2025. ” (4)
Energy efficiency has gained recognition as a leading method to reduce the emissions of GHG’s seen to be the cause of climate change. Under scrutiny, we find that there are different measures of efficiency across different industry, fuel types and levels. For example on a micro-level, the functioning of a system may be improved by including higher efficiency components in it’s design, such as motors and pumps.
However, there are other changes which can improve efficiency. Adding automated computer controls can improve a system level efficiency. Utilities may change from coal burning to natural gas fired power plants, or industry may convert to a process to include for co-generation. Battery storage and other technological improvements may come along to fill in the gap.
Historically Energy Efficiency measures have proven to be gaining ground by employing people with the savings earned when applying measures to reduce consumption. These savings reverberate through the economy in a meaningful way, by reducing the need for the construction of more power plants as one example as we on an individual level. We consume less energy, and using higher efficiency electronic equipment, and other energy savings measures at a consumer level, our communities are capable of more growth with existing energy supplies.
jEnergy production and consumption, as well as population growths also arise to other issues related to energy consumption, such as water consumption, water waste, and solid material waste. Building with sustainable materials which promote healthy living environments is gaining importance as we understand the health impacts of a building’s environment on the health and well-being of the occupants. Energy efficiency in the modern era, as we see from recent government mandates and sustainability programs, such as LEED’s for one, also includes for reductions in water intensity and incorporation of renewable energy programs as an alternative to increasing demand on existing utilities.
Related Blog Posts:
References
“Apple has created a subsidiary to sell the excess electricity generated by its hundreds of megawatts of solar projects. The company, called Apple Energy LLC, filed a request with the Federal Energy Regulatory Commission to sell power on wholesale markets across the US.
The company has announced plans for 521 megawatts of solar projects globally. It’s using that clean energy to power all of its data centers, as well as most of its Apple Stores and corporate offices. In addition, it has other investments in hydroelectric, biogas, and geothermal power, and looks to purchase green energy off the grid when it can’t generate its own power. In all, Apple says it generates enough electricity to cover 93 percent of its energy usage worldwide.
But it’s possible that Apple is building power generation capacity that exceeds its needs in anticipation of future growth. In the meantime, selling off the excess helps recoup costs by selling to power companies at wholesale rates, which then gets sold onward to end customers.
It’s unlikely that Apple, which generated more than $233 billion in revenue in fiscal 2015, will turn power generation into a meaningful revenue stream — but it might as well get something out of the investment. The company issued $1.5 billion in green bonds earlier this year to finance its clean energy projects.” (2)
Related Articles:
References:
When we talk about the emerging Smart Grid there comes with the topic an array of exciting and new technologies; Micro-Grids, Distributed Generation, Smart Meters, Load Shifting, Demand Response, Electric Vehicles with Battery Storage for Demand Response, and more. Recent development in Renewable Energy sources has been driven by concerns over Climate Change, allowing for unprecedented growth in residential and commercial PV Solar Panel installations.

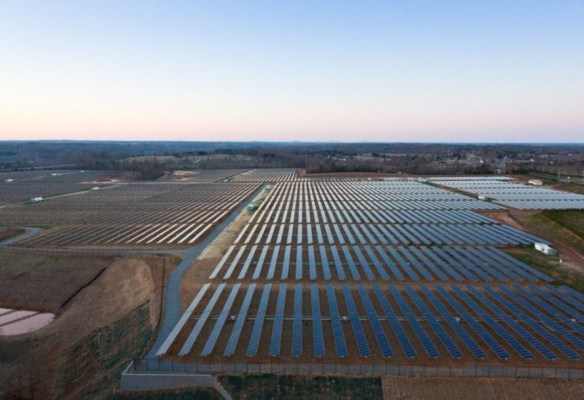
Figure 1: Redwood High School in Larkspur, CA installed a 705kW SunPower system that’s projected to save $250,000 annually. The carports include EV charging stations for four cars. (1)
Climate Change and burning of fossil fuels are hot topics in the world. Most recently the city of San Francisco has mandated the installation of solar panels on all new buildings constructed under 10 storeys, which will come into effect in 2017 as a measure to reduce carbon emissions. Currently all new buildings in California are required to set aside 15% of roof area for solar. (2)
“Under existing state law, California’s Title 24 Energy Standards require 15% of roof area on new small and mid-sized buildings to be “solar ready,” which means the roof is unshaded by the proposed building itself, and free of obtrusions. This state law applies to all new residential and commercial buildings of 10 floors or less.
Supervisor Wiener’s ordinance builds on this state law by requiring this 15% of “solar ready” roof area to have solar actually installed. This can take the form of either solar photovoltaic or solar water panels, both of which supply 100% renewable energy.” (3)
Weather and Aging Infrastructure:
Despite an increasing abundance of energy-efficient buildings and other measures, electricity demand has risen by around 10% over the last decade, partly driven by the massive growth of digital device usage and the expanding demand for air conditioning, as summers continue to get hotter in many states.
According to 2013 data from the Department of Energy (DOE), US power grid outages have risen by 285% since records on blackouts began in 1984, for the most part driven by the grid’s vulnerability to unusual and extreme weather events – such as the devastating Hurricane Sandy in 2012 that caused extensive power outages across the East Coast – which are becoming less unusual as the years roll on.
“We used to have two to five major weather events per year from the 50s to the 80s,” said University of Minnesota Professor of Electrical and Computer Engineering Massoud Amin in a 2014 interview with the International Business Times.
“Between 2008 and 2012, major outages caused by weather increased to 70 to 130 outages per year. Weather used to account for about 17% to 21% of all root causes. Now, in the last five years, it’s accounting for 68% to 73% of all major outages.” (4)
The established model of providing power to consumers involves the supply of electricity generated from a distant source and transmitted at high voltage to sub-stations local to the consumer, refer to Figure 2. The power plants that generate the electricity are mostly thermo-electric (coal, gas and nuclear power), with some hydro-electric sources (dams and reservoirs) and most recently wind farms and large solar installations.
“The national power grid that keeps America’s lights on is a massive and immensely valuable asset. Built in the decades after the Second World War and valued today at around $876bn, the country’s grid system as a whole connects electricity from thousands of power plants to 150 million customers through more than five million miles of power lines and around 3,300 utility companies.” (4)

Figure 2: Existing Transmission and Distribution Grid Structure within the Power Industry (5)
The (Transmission & Distribution) market supplies equipment, services and production systems for energy markets. The initial stage in the process is converting power from a generation source (coal, nuclear, wind, etc.) into a high voltage electrical format that can be transported using the power grid, either overhead or underground. This “transformation” occurs very close to the source of the power generation.
The second stage occurs when this high-voltage power is “stepped-down” by the use of switching gears and then controlled by using circuit breakers and arresters to protect against surges. This medium voltage electrical power can then be safely distributed to urban or populated areas.
The final stage involves stepping the power down to useable voltage for the commercial or residential customer. In short, while power generation relates to the installed capacity to produce energy from an organic or natural resource, the T&D space involves the follow up “post-power generation production” as systems and grids are put in place to transport this power to end users. (5)
The Smart Grid is an evolution in multiple technologies which in cases is overlaying or emerging from the existing grid. New generating facilities such as wind power or solar installations which may be small or local to a municipal or industrial user are being tied into the existing grid infra-structure. In some cases residential PV Solar systems are being tied into the Grid with some form of agreement to purchase excess energy, in some cases at rates favorable to the installer, depending on the utility and region.
Another characteristic of the evolving Smart Grid is in communication technology and scalability. Use of wifi protocols for communication between parts of the system allow for new processes and access to resources which were previously unavailable. Ability to control systems to defer demand to non-peak hours within a building as one example.
Microgrids, smaller autonomous systems servicing a campus of buildings or larger industry, may plug into a larger City-wide Smart Grid in a modular manner. In the event of a catastrophic event such as a hurricane or earthquake the Smart Grid offers users resiliency through multiple sources of energy supply.
Distributed Generation includes a number of different and smaller scale energy sources into the mix. The newer, small scale Renewable Energy projects which are being tied to the electrical grid as well as other technologies such as Co-Generation, Waste To Energy facilities, Landfill Gas Systems, Geothermal and the like. As growth continues there needs to be ways to control and manage these multiple energy sources into the grid. Also increased needs to maintain privacy, isolate and control systems, and prevent unauthorized access and control. This is leading to growth in Energy Management and Security Systems.

Figure 3: An artist’s rendering of the massive rail used in the ARES power storage project to store renewable energy as gravitational potential energy. Source: ARES North America (6)
Energy Storage is emerging as necessary in the Smart Grid due to fluctuations in source supply of energy, especially Solar and Wind Power, and the intermittent and cyclical nature of user demand. The existing grid does not have the need for energy storage systems as energy sources were traditionally large power stations which generally responded to anticipated need during the course of the day.
As more Renewable Energy systems go online the need for storage will grow. Energy Storage in its various forms will also enable Load Shifting or Peak Shaving strategies for economic gains in user operations. These strategies are already becoming commercially available for buildings to save the facility operators rate charges by limiting demand during peak periods at higher utility rates.

Figure 4: Effect of Peak Shaving using Energy Storage (6)
Peak-load shifting is the process of mitigating the effects of large energy load blocks during a period of time by advancing or delaying their effects until the power supply system can readily accept additional load. The traditional intent behind this process is to minimize generation capacity requirements by regulating load flow. If the loads themselves cannot be regulated, this must be accomplished by implementing energy storage systems (ESSs) to shift the load profile as seen by the generators (see Figure 4).
Depending on the application, peak-load shifting can be referred to as “peak shaving” or “peak smoothing.” The ESS is charged while the electrical supply system is powering minimal load and the cost of electric usage is reduced, such as at night. It is then discharged to provide additional power during periods of increased loading, while costs for using electricity are increased. This technique can be employed to mitigate utility bills. It also effectively shifts the impact of the load on the system, minimizing the generation capacity required. (6)
Challenges with chemical storage systems such as batteries are scale and cost. Currently pumped hydro is the predominant method of storing energy from intermittent sources providing 99% of global energy storage. (7)

Figure 5: Actual Savings accrued due to Demand Response Program (8)
Demand Response (DR) is another technology getting traction in the Smart Grid economy. As previously mentioned Energy Management and Security Systems are “…converging with Energy Storage technology to make DR a hot topic. First, the tools necessary to determine where energy is being stored, where it is needed and when to deliver it is have developed over decades in the telecommunications sector. Secondly, the more recent rush of advanced battery research is making it possible to store energy and provide the flexibility necessary for demand response to really work. Mix that with the growing ability to generate energy on premises through solar, wind and other methods (Distributed Generation) and a potent new distributed structure is created.” (9)
Demand response programs provide financial incentives to reduce energy consumption during peak periods of energy demand. As utilities and independent system operators (ISOs) are pressured to keep costs down and find ways to get as many miles as they can out of every kilowatt, demand response programs have gained popularity. (8)

Figure 6: The Demonstration Project 2’s Virtual Power Plant (10)
Virtual Power Plant: When an increasing share of energy is produced by renewable sources such as solar and wind, electricity production can fluctuate significantly. In the future there will be a need for services which can help balance power systems in excess of what conventional assets will be able to provide. Virtual power plants (VPPs) are one of the most promising new technologies that can deliver the necessary stabilising services. (11)
In the VPP model an energy aggregator gathers a portfolio of smaller generators and operates them as a unified and flexible resource on the energy market or sells their power as system reserve.
VPPs are designed to maximize asset owners’ profits while also balancing the grid. They can match load fluctuations through forecasting, advance metering and computerized control, and can perform real-time optimization of energy resources.
“Virtual power plants essentially represent an ‘Internet of Energy,’ tapping existing grid networks to tailor electricity supply and demand services for a customer,” said Navigant senior analyst Peter Asmus in a market report. The VPP market will grow from less than US $1 billion per year in 2013 to $3.6 billion per year by 2020, according to Navigant’s research — and one reason is that with more variable renewables on the grid flexibility and demand response are becoming more crucial. (12)
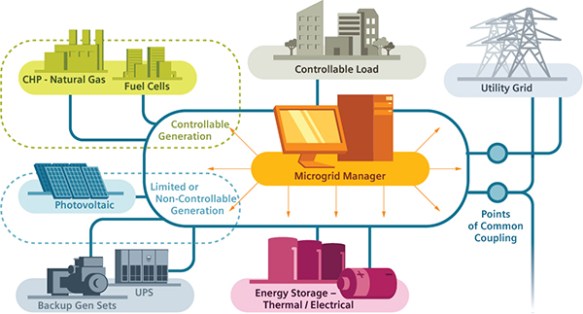
Figure 7: Example of a Microgrid System With Loads, Generation, Storage and Coupling to a Utility Grid (13)
Microgrids: Microgrids are localized grids that can disconnect from the traditional grid to operate autonomously and help mitigate grid disturbances to strengthen grid resilience (14). The structure of a microgrid is a smaller version of the smart grid formed in a recursive hierarchy where multiple local microgrids may interconnect to form the larger smart grid which services a region or community.
The convergence of aging existing infrastructure, continued growth in populations and electrical demand and concerns over climate change have lead to the emerging smart grid and it’s array of new technologies. This trend is expected to continue as new growth and replacement will be necessary for an aging electrical grid system, from the larger scope transmission systems and utilities, to smaller scale microgrids. These systems will become integrated and modular, almost plug-and-play, with inter-connectivity and control through wireless internet protocols.
Floating arrays have been installed on surfaces such as water reservoirs as these “land areas” are already committed to a long-term purpose. Solar power is considered a good synchronistic fit, and most recently work was completed in England seeing “23,000 solar panels on the Queen Elizabeth II reservoir at Walton-on-Thames”. (1)
Water utilities are the first to see the benefit of solar panel installations as the power generated is generally consumed by the utilities operations for water treatment and pumping. This of course offsets demand requirements from the electrical utility and reduces operating costs with a ROI from the installation. Possible government or other industry incentives and subsidies may enhance benefits. Last year a 12,000 panel system was installed on a reservoir near Manchester (UK) and was the second of it’s kind in Britain, dwarfing the original installation of 800 panels. (2) (3)
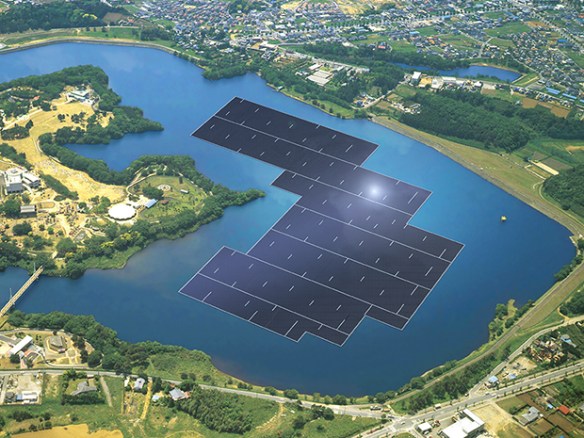
Image #1: World’s largest floating array of PV Solar Panels in Japan (4)
Currently Japan has the most aggressive expansion plans for reservoir installations, with the most recent being the world’s largest of it’s kind. Recent changes in energy policies and the ongoing problems associated with Nuclear Power has propelled Japan into aggressively seeking alternative forms of energy.
“The 13.7-megawatt power station, being built for Chiba Prefecture’s Public Enterprise Agency, is located on the Yamakura Dam reservoir, 75 kilometers east of the capital. It will consist of some 51,000 Kyocera solar modules covering an area of 180,000 square meters, and will generate an estimated 16,170 megawatt-hours annually. That is “enough electricity to power approximately 4,970 typical households,” says Kyocera. That capacity is sufficient to offset 8,170 tons of carbon dioxide emissions a year, the amount put into the atmosphere by consuming 19,000 barrels of oil.”
“[…]“Due to the rapid implementation of solar power in Japan, securing tracts of land suitable for utility-scale solar power plants is becoming difficult,” Toshihide Koyano, executive officer and general manager of Kyocera’s solar energy group told IEEE Spectrum. “On the other hand, because there are many reservoirs for agricultural use and flood-control, we believe there’s great potential for floating solar-power generation business.”
He added that Kyocera is currently working on developing at least 10 more projects and is also considering installing floating installations overseas.” (4)
A Brownfield is defined generally by the EPA (5)
A brownfield is a property, the expansion, redevelopment, or reuse of which may be complicated by the presence or potential presence of a hazardous substance, pollutant, or contaminant. It is estimated that there are more than 450,000 brownfields in the U.S. Cleaning up and reinvesting in these properties increases local tax bases, facilitates job growth, utilizes existing infrastructure, takes development pressures off of undeveloped, open land, and both improves and protects the environment.

Image #2: 6-MW solar PV array on the site of the former Palmer Metropolitan Airfield (6)
Traditionally most solar projects have been built on “Greenfields”, however, on further analysis it makes far more sense to install solar on “Brownfields”.
The U.S. is home to more than 450,000 brownfields – unused property that poses potential environmental hazards. Eyesores as well as potential health and safety threats, brownfield sites reduce urban property values. Rehabilitating them pays off, and in more ways than one, according to a July, 2014 National Bureau of Economic Research (NBER) working paper entitled, ¨The Value of Brownfield Remediation.¨ […]
NBER researchers determined that remediation increased the value of individual brownfield sites $3,917,192, with a median value of $2,117,982. That compares to an estimated per-site cost of $602,000. In percentage terms across the study’s nationally representative sample, EPA-supported clean-ups resulted in property price increases of between 4.9% and 32.2%. (6)
In another example where a Brownfield remediation effort has payed off utilizing a Solar Power upgrade is at the Philadelphia Navy Yard according to a June 2011 report by Dave Levitan (7) where it says:
“The Navy Yard solar array is just one of a growing number of projects across the U.S. that fall into the small category of energy ideas that appear to have little to no downside: turning brownfields — or sites contaminated
Every solar project that rises from an industrial wasteland is one that won’t be built on pristine land.
or disturbed by previous industrial activity — into green energy facilities. Among the successfully completed brown-to-green projects are a wind farm at the former Bethlehem Steel Mill in Lackawanna, New York; a concentrating solar photovoltaic array on the tailings pile of a former molybdenum mine in Questa, New Mexico; solar panels powering the cleanup systems at the Lawrence Livermore National Laboratory’s Superfund site in northern California; and the U.S. Army’s largest solar array atop a former landfill in Fort Carson, Colorado.”
Building solar power projects on top of closed off landfills appears to be a good idea, however, there are additional considerations and requirements which must be met which would exceed those of a normal type of undisturbed geology.
“Construction and ongoing operation of the plant must never break, erode or otherwise impair the functioning integrity of the landfill final closure system (including any methane gas management system) already in place.” (8) […]

Image #3: Prescriptive Landfill Capping System
In general, the features of a conventional “Subtitle D” final protection barrier cover system on USA waste sites are shown in the illustration above and include the following layers added on top of a waste pile:

Image #4: Established Solar Energy Projects on Closed Landfills (9)
As of 2013 we can see that there already have been a number of solar installations and that this number is still growing through to the present as more municipalities seek ways to convert their closed landfills into a renewable resource and asset.
A greenfield site is defined as an area of agricultural or forest land, or some other undeveloped site earmarked for commercial development or industrial projects. This is compared to a brownfield site which is generally unsuitable for commercial development or industrial projects due to the presence of some hazardous substance, pollutant or contaminant.
While a water reservoir is not a contaminated site, it is generally rendered useless for most purposes, however provides an ideal site for locating solar panels as they provide relatively large areas of unobstructed sun. Also reservoirs provide water cooling which enhances energy efficiency and PV performance. Uncovered reservoirs can be partially covered by floating arrays of PV panels, of modest to large sizes in the 16 MW range. Installations can be found throughout the world, including England and most recently Japan where interest in alternative energy sources is growing rapidly.
A brownfield site is considered ideal for the location of a solar plant as a cost-effective method of an otherwise useless body of land, such as a decommissioned mine, quarry, or contaminated site. A landfill is one form of brownfield site which could be suitable for the installation of solar power where provision has been made to protect the cap on the landfill. Municipalities have been showing growing interest in landfill solar as a means to offset operational costs.
PV – Photo Voltaic
CSP – Concentrated Solar Power
ROI – Return On Investment
UK – United Kingdom
NBER – National Bureau of Economic Research
EPA – Environmental Protection Agency

Image Source: U.S. Energy Information Administration (1)
“It doesn’t always rain when you need water, so we have reservoirs – but we don’t have the same system for electricity,” says Jill Cainey, director of the UK’s Electricity Storage Network.
[…] Big batteries, whose costs are plunging, are leading the way. But a host of other technologies, from existing schemes like splitting water to create hydrogen,compressing air in underground caverns, flywheels and heated gravel pits, to longer term bets like supercapacitors and superconducting magnets, are also jostling for position.
In the UK, the first plant to store electricity by squashing air into a liquid is due to open in March, while the first steps have been taken towards a virtual power station comprised of a network of home batteries.
“We think this will be a breakthrough year,” says John Prendergast at RES, a UK company that has 80MW of lithium-ion battery storage operational across the world and six times more in development, including its first UK project at a solar park near Glastonbury. “All this only works if it reduces costs for consumers and we think it does,” he says.
Energy storage is important for renewable energy not because green power is unpredictable – the sun, wind and tides are far more predictable than the surge that follows the end of a Wimbledon tennis final or the emergency shutdown of a gas-fired power plant. Storage is important because renewable energy is intermittent: strong winds in the early hours do not coincide with the peak demand of evenings. Storage allows electricity to be time-shifted to when it is needed, maximising the benefits of windfarms and solar arrays. (2)
“GE has announced it is working on a way to use CO2 pollution to make new types of solar batteries that could each power up to 100,000 homes. CO2 is the main contributor to climate change, and is released into the atmosphere when coal is processed at power plants. Currently environmental procedures mean that some CO2 from these plants is captured and stored, so it’s not released back into the atmosphere. But the question has always been: What do you do with the stored gas?” (1)

Figure #1: Comparison of 10 MWe Turbines (2)
What are the Benefits of Supercritical CO2? With the transition from steam generation to using Supercritical CO2 as a working fluid, we seen large gains in energy efficiency conversion, coupled with significant size (footprint) reduction of turbomachines. Other benefits include sequestering CO2 from the environment and reducing GHG emissions. Also, this system can be utilized to capture energy from other heat sources including waste heat streams and co-generation applications.

Figure 2: Relative size comparison of steam, helium and supercritical CO2 turbomachinery for Generation IV Nuclear Reactors (3)
What is Supercritical CO2? “[…] Supercritical CO2 is a fluid state of carbon dioxide where it is held above its critical pressure and critical temperature which causes the gas to go beyond liquid or gas into a phase where it acts as both simultaneously. Many fluids can achieve supercritical states and supercritical steam has been used in power generation for decades. Supercritical CO2 has many unique properties that allow it to dissolve materials like a liquid but also flow like a gas. sCO2 is non-toxic and non-flammable and is used as an environmentally-friendly solvent for decaffeinating coffee and dry-cleaning clothes.

Figure 3: CO2 phase diagram illustrating supercritical region. (4)
The use of sCO2 in power turbines has been an active area of research for a number of years, and now multiple companies are bringing early stage commercial products to market. The attraction to using sCO2 in turbines is based on its favorable thermal stability compared to steam which allows for much higher power outputs in a much smaller package than comparable steam cycles. CO2 reaches its supercritical state at moderate conditions and has excellent fluid density and stability while being less corrosive than steam. The challenges in using sCO2 are tied to identifying the best materials that can handle the elevated temperatures and pressures, manufacturing turbo machinery, valves, seals, and of course, costs. […] ” (2)
How will this work?
“[…] The design has two main parts. The first one collects heat energy from the sun and stores it in a liquid of molten salt. “This is the hot side of the solution,” Sanborn says. The other component uses surplus electricity from the grid to cool a pool of liquid CO2 so that it becomes dry ice.
During power generation, the salt releases the heat to expand the cold CO2 into a supercritical fluid, a state of matter where it no longer has specific liquid and gas phases. It allows engineers to make the system more efficient.
The supercritical fluid will flow into an innovative CO2 turbine called the sunrotor, which is based on a GE steam turbine design. Although the turbine can fit on an office shelf (see image above) it can generate as much as 100 megawatts of “fast electricity” per installed unit—enough to power 100,000 U.S. homes.
Sanborn believes that a large-scale deployment of the design would be able to store “significant amounts” of power —— and deliver it back to the grid when needed. “We’re not talking about three car batteries here,” he says. “The result is a high-efficiency, high-performance renewable energy system that will reduce the use of fossil fuels for power generation.”
He says the system could be easily connected to a solar power system or a typical gas turbine. The tanks and generators could fit on trailers. His goal is to bring the cost to $100 per megawatt-hour, way down from the $250 it costs to produce the same amount in a gas-fired power plant. “It is so cheap because you are not making the energy, you are taking the energy from the sun or the turbine exhaust, storing it and transferring it,” says Sanborn.
The process is also highly efficient, Sanborn says, yielding as much as 68 percent of the stored energy back to the grid. The most efficient gas power plants yield 61 percent. The team is now building a conceptual design, which Sanborn believes could take five to 10 years to get from concept to market. […]” (5)
Read more at:
1. https://duanetilden.com/2013/10/29/supercritical-co2-refines-cogeneration-for-industry/
References:

Image Credit: GTM Research / SEIA U.S. Solar Market Insight
Source Credit: March 9 (SeeNews) by Plamena Tisheva
“[…] The market will be driven by the utility-scale segment, which will account for 74% of annual installations following a rush to take advantage of the federal Investment Tax Credit (ITC) that was initially set to expire at the end of this year. The residential and commercial markets are also expected to see strong growth in 2016, though.
With the ITC now extended, state-level drivers and risks will move to the forefront in 2016, says the US Solar Market Insight Report 2015, published in conjunction with the Solar Energy Industries Association (SEIA).
In 2017, the US solar market is expected to shrink to 10 GW due to the pull-in of utility demand in 2016. “But between 2018 and 2020, the extension of the ITC will reboot market growth for utility PV and support continued growth in distributed solar as a growing number of states reach grid parity,” said GTM Research senior analyst Cory Honeyman. […]”
Source Link: http://bit.ly/1LdMdRB

With 88 projects from coast to coast, it might be the biggest grid edge R&D effort ever. Here’s how the money is going to be spent.
Sourced through Scoop.it from: www.greentechmedia.com
“[…] The Grid Modernization Multi-Year Program Plan will bring a consortium of 14 national laboratories together with more than 100 companies, utilities, research organizations, state regulators and regional grid operators. The scope of this work includes integrating renewable energy, energy storage and smart building technologies at the edges of the grid network, at a much greater scale than is done today.
That will require a complicated mix of customer-owned and utility-controlled technology, all of which must be secured against cyberattacks and extreme weather events. And at some point, all of this new technology will need to become part of how utilities, grid operators, regulators, ratepayers and new energy services providers manage the economics of the grid.
DOE has already started releasing funds to 10 “pioneer regional partnerships,” or “early-stage, public-private collaborative projects […] The projects range from remote microgrids in Alaska and grid resiliency in New Orleans, to renewable energy integration in Vermont and Hawaii, and scaling up to statewide energy regulatory overhauls in California and New York. Others are providing software simulation capabilities to utilities and grid operators around the country, or looking at ways to tie the country’s massive eastern and western grids into a more secure and efficient whole.
Another six “core” projects are working on more central issues, like creating the “fundamental knowledge, metrics and tools we’re going to need to establish the foundation of this effort,” he said (David Danielson). Those include technology architecture and interoperability, device testing and validation, setting values for different grid services that integrated distributed energy resources (DERs) can provide, and coming up with the right sensor and control strategy to balance costs and complexity.
Finally, the DOE has identified six “cross-cutting” technology areas that it wants to support, Patricia Hoffman, assistant secretary of DOE’s Office of Electricity Delivery and Energy Reliability, noted in last week’s conference call. Those include device and integrated system testing, sensing and measurement, system operations and controls, design and planning tools, security and resilience, and institutional support for the utilities, state regulators and regional grid operators that will be the entities that end up deploying this technology at scale.
Much of the work is being driven by the power grid modernization needs laid out in DOE’s Quadrennial Energy Review, which called for $3.5 billion in new spending to modernize and strengthen the country’s power grid, while the Quadrennial Technology Review brought cybersecurity and interoperability concerns to bear.[…]
DOE will hold six regional workshops over the coming months to provide more details, Danielson said. We’ve already seen one come out this week — the $18 million in SunShot grants for six projects testing out ways to bring storage-backed solar power to the grid at a cost of less than 14 cents per kilowatt-hour.
“We can’t look at one attribute of the grid at a time,” he said. “We’re not just looking for a secure grid — we’re looking for an affordable grid, a sustainable grid, a resilient grid.” And one that can foster renewable energy and greenhouse gas reduction at the state-by-state and national levels. […]
