Using Building Air Conditioning Systems For Carbon Capture and Synthetic Fuels

There have been many global developments on the science of CO2 recovery from the atmosphere. Existing and future buildings use A/C systems for temperature control of ventilation systems. Large buildings move massive amounts of air during the course of a day.

At design rates of 10 to 20 cfm (cubic feet/minute) per person large assemblies or office towers rates of ventilation can reach up to 100,000 cfm or more per building. This air is required to be temperature controlled, which is achieved by air conditioning units, which extract heat energy from the air stream and reject this heat to the outside (a heat pump can also operate in reverse mode, heating the inside air stream and absorbing heat from the outside air).

The fan motors used to move the conditioned air consumes considerable electricity to operate as do the outside air fans used to cool the A/C system. The outside cooling (heating) loop is operated by forcing air through fin-tube radiators which contain pressurized refrigerant circulating in a closed loop cycle.

Calgary-based Carbon Engineering’s first direct air capture plant in Squamish, B.C. David Keith, the founder of Carbon Engineering, thinks the idea of AC integrated carbon capture systems is attractive, but may not be practical because of economies of scale. (THE CANADIAN PRESS/Darryl Dyck) (1)

It has been proposed to incorporate carbon capture and sequestration in these systems and create a new, clean energy source which can be re-introduced to the economy as a fuel and material feed-stock for a variety of industries.

However, the process is not without certain drawbacks. One major hurdle is finding the additional energy required to further process the captured CO2 into a viable fuel. The process requires electrolysis of water and other energy inputs to refine the captured carbon. It is proposed that PV Cells would be a good energy source for the process.

“[…] In a new analysis, scientists argue for using air conditioning units to capture carbon dioxide straight from the atmosphere and transform it into fuel. The idea is that these renewable-energy powered devices would lower atmospheric CO2 and provide a scalable alternative to oil, natural gas and other fossil fuels.

The conversion tech would first take in CO2 and water from the air. Then, an electric current would split the water into hydrogen and oxygen. Finally, combining the hydrogen with the captured CO2 would produce hydrocarbon fuel.

It’s all theoretical for now, but the technology for each step of the process already exists. Companies like Climeworks in Switzerland, Siemens AG in Germany and Green Energy in the US, have commercialized technologies that separately capture CO2 directly from the air, isolate hydrogen from water and produce fuels. But a complete system that puts all of the pieces together, is lacking. The fact that the components are available, however, means “it would be not that difficult technically to add a CO2 capture functionality to an A/C system,” the authors write.

If air conditioners were equipped with the appropriate technologies, the researchers calculate Fair Tower, a landmark office building in downtown Frankfurt am Main in Germany, could produce 550 to 1,100 pounds of liquid hydrocarbon fuels every hour, or about 2,200 to 44,00 tons per year. When the researchers extrapolated on this calculation they found the five cities in Germany with the largest office space could together produce 2.6 to 5.3 million tons of fuel each year, the team reports Tuesday in the journal Nature Communications. […]” (2)

  1. https://www.cbc.ca/radio/quirks/may-4-2019-brain-resuscitation-hippos-supply-algae-skeletons-slug-surgical-glue-and-more-1.5119885/how-air-conditioners-could-keep-you-cool-and-capture-carbon-1.5119911
  2. http://blogs.discovermagazine.com/d-brief/2019/04/30/could-air-conditioners-convert-atmospheric-co2-to-fuel/#
Advertisement

Study Finds BC Pension Fund Manager is Funding Climate Agreement Breach

A study* released by the Corporate Mapping Project (CMP), a watchdog organization indicates that public pensions could be overly invested in the fossil fuel industry. This is a concern as international agreements signed by Canada are directed to reducing emissions, while public money is invested in an agenda that requires growth and production in a sector which is in decline.

Image result for kinder morgan pipeline

Figure 1. Map of proposed expansion current pipeline and tanker route – Kinder Morgan / Trans Mountain Pipeline. (1)


Image result for kinder morgan pipeline

Figure 2. Map of impact of refinery facilities and proximity to conservation areas, a University, a Salmon spawning inlet, residential housing and major transport routes. (1)


The area that will be impacted by the growth of the facility are diverse and vulnerable. This is not a brownfield development, and in fact is on the side of a mountain and part of a larger watershed. Serious consideration should be given to relocating the facility or decommissioning.

There are alternate locations better suited for this type of high hazard industrial facility, away from sensitive areas and remote from populations and high traffic harbours. Why are these alternatives not being discussed?

Here’s a snippet taken from the introduction of the report and their findings. How can we stop carbon emissions when local investing strategies are in the opposite direction? Are public pension funds safely invested and competently managed? Likely not.


CMP researchers Zoë Yunker, Jessica Dempsey and James Rowe chose to look into BCI’s investment practices because it controls one of the province’s largest pools of wealth ($135.5 billion) — the pensions of over half-a-million British Columbians. Which means BCI’s decisions have a significant impact on capital markets and on our broader society.

Their research asked, “Is BCI is investing funds in ways that effectively respond to the climate change crisis?”

Unfortunately, the answer is “No.” BCI has invested billions of dollars in companies with large oil, gas and coal reserves — companies whose financial worth depends on overshooting their carbon budget — and is even increasing many investments in these companies.

As another recent CMP study clearly shows what’s at stake. Canada’s Energy Outlook, authored by veteran earth scientist David Hughes, reveals that the projected expansion of oil and gas production will make it all but impossible for Canada to meet our emissions-reduction targets. The study also shows that returns to the public from oil and gas production have gone down significantly. (2)


*This study is part of the Corporate Mapping Project (CMP), a research and public engagement initiative investigating the power of the fossil fuel industry. The CMP is jointly led by the University of Victoria, Canadian Centre for Policy Alternatives and the Parkland Institute. This research was supported by the Social Science and Humanities Research Council of Canada (SSHRC).

References:

  1. kinder_morgan_pipeline_route_maps
  2. fossil-fuelled-pensions

Oilsands and Fossil Fuels Receive Major Blow Due to Paris Agreement

LONDON — Europe’s largest bank HSBC said on Friday it would mostly stop funding new coal power plants, oilsands and arctic drilling, becoming the latest in a long line of investors to shun the fossil fuels.

Other large banks such as ING and BNP Paribas have made similar pledges in recent months as investors have mounted pressure to make sure bank’s actions align with the Paris Agreement, a global pact to limit greenhouse gas emissions and curb rising temperatures.

“We recognize the need to reduce emissions rapidly to achieve the target set in the 2015 Paris Agreement… and our responsibility to support the communities in which we operate,” Daniel Klier, group head of strategy and global head of sustainable finance, said in a statement.

via Europe’s biggest bank HSBC says it will no longer finance oilsands projects — Financial Post

Sustainable Smart Cities and Disaster Mitigation – Preparing for the 1000 Year Storm

Hurricanes Cause Massive Damage

In light of recent events, such as the current hurricane season of 2017 which has already struck large sections of Texas with Hurricane Harvey causing massive damage which has been estimated at $180 billion by Texas Governor Greg Abbott (1) there are questions about how we can prepare cities better for disaster. One method considered is in our building codes, which are constantly being upgraded and improved, by constructing buildings to be more resilient and handle harsher conditions.

There is a limit to what a building code can do and enforce. Areas and regions that have seen widespread destruction, will have to be rebuilt.  However, to what standards? The existing building codes will have to be examined for their efficacy in storm-proofing buildings to withstand the effects of high winds and water penetration, some of which has already been performed.

Codes do not prevent external disasters such as from storms, tornadoes, tidal waves (tsunami), earthquakes, forest fire, lightning, landslides, nuclear melt-down and other extreme natural and man-made events. What building codes do is establish minimum standards of construction for various types of buildings and structures. Damage to buildings, vehicles, roads, power systems and other components of a city’s infrastructure are vulnerable to flooding which cannot be addressed in a building code. Other standards are needed to address this problem.

Storm-Proofing Cities

Other issues arise regarding flooding, and how water can be better managed in the future to mitigate water collection and drainage. These may require higher levels of involvement across a community and perhaps beyond municipal constraints, requiring state-wide developments. Breakwaters, sea walls, levees, spill ways and other forms of structures may be added to emergency pumping stations and micro-grid generator/storage facilities as examples of infrastructure improvements that could be utilized.

Bigger decisions may have to be considered as to the level of reconstruction of buildings in vulnerable areas. Sea warming as noted occurring has some scientists pondering if there is a connection between global warming and increased storm volatility as indicated by water temperature rises and tidal records (2). If bigger and more frequent storms are to come, then it must be considered in future building and infrastructure planning.

Regional Infrastructure and Resiliency

Exposed regions as well as larger, regional concerns in areas of maintaining power, roadways, and diverting and draining water are major in the resiliency of a community. When a social network breaks down, there is much lost, and recovery of a region can be adversely affected by loss of property and work.

Many of the lower classes will not have insurance and lose everything. Sick and elderly can be especially exposed, not having means to prepare or escape an oncoming disaster, and many will likely perish unless they can get access to aide or a shelter quickly.

Constructing better sea walls and storm surge barriers may be an effective means to diverting water in the event of a hurricane on densely populated coastal areas. Although considered costly to construct, they are a fraction of the cost of damage that may be caused by a high, forceful storm surge which can obliterate large unprotected populated areas. The Netherlands and England have made major advancements in coastal preparedness for storms.

Storm Surge Barriers

Overall Effectiveness for Reducing Flood Damage

There are only a few storm surge barriers in the United States, although major systems installed abroad demonstrate their efficacy. The Eastern Scheldt barrier in the Netherlands (completed in 1986) and the Thames barrier in the United Kingdom (completed in 1982) have prevented major flooding. Lavery and Donovan (2005) note that the Thames barrier, part of a flood risk reduction system of barriers, floodgates, floodwalls, and embankments, has reliably protected the City of London from North Sea storm surge since its completion.

Four storm surge barriers were constructed by the USACE in New England in the 1960s (Fox Point, Stamford, New Bedford, and Pawcatuck) and a fifth in 1986 in New London, Connecticut. The barriers were designed after a series of severe hurricanes struck New England in 1938, 1944, and 1954 (see Appendix B), which highlighted the vulnerability of the area. The 1938 hurricane damaged or destroyed 200,000 buildings and caused 600 fatalities (Morang, 2007; Pielke et al., 2008).

The 2,880-ft (878-m) Fox Point Barrier (Figure 1-8) stretches across

the Providence River, protecting downtown Providence, Rhode Island. The barrier successfully prevented a 2-ft (0.6-m) surge elevation (in excess of tide elevation) from Hurricane Gloria in 1985 and a 4-ft (1.2-m) surge from Hurricane Bob in 1991 (Morang, 2007) and was also used during Hurricane Sandy. The New Bedford, Massachusetts, Hurricane Barrier consists of a 4,500-ft-long (1372-m) earthen levee with a stone cap to an elevation of 20 ft (6 m), with a 150-ft-wide (46-m) gate for navigation. The barrier was reportedly effective during Hurricane Bob (1991), an unnamed coastal storm in 1997 (Morang, 2007), and Hurricane Sandy. During Hurricane Sandy, the peak total height of water (tide plus storm surge) was 6.8 feet (2.1 m), similar to the levels reached in 1991 and 1997. The Stamford, Connecticut, Hurricane Barrier has experienced six storms producing a surge of 9.0 ft (2.7 m) or higher between its completion (1969) and Hurricane Sandy. During Hurricane Sandy, the barrier experienced a storm surge of 11.1 ft (3.4 m), exceeding that of the 1938 hurricane (USACE, 2012). (3)

The biggest challenge is to build storm surge barriers large enough for future Hurricanes. There is a question that given the magnitude of current and future storms that these constructed barriers may be breached.  Engineers design structures to meet certain standards, and with weather these were the unlikely 1 in 100 year storm events. However, this standard is not good enough as Hurricane Katrina in Louisiana exemplified, as being rated a 1 in 250 year storm event. With climate changes these events may become more frequent.

Much of the damage from Katrina came not from high winds or rain but from storm surge that caused breaches in levees and floodwalls, pouring water into 80 percent of New Orleans. To the south, Katrina flooded all of St. Bernard Parish and the east bank of Plaquemines Parish. Plaquemines Parish flooded again in 2012 with Hurricane Isaac.

Soon after Katrina, Congress directed the Corps of Engineers to build a system that could protect against a storm that has a 1 percent chance of happening each year, a “1-in-100-year” storm.

The standard is less a measure of safety and more a benchmark that allows the city to be covered by the National Flood Insurance Program. Louisiana’s master coastal plan calls for a much stronger 500-year system. The corps says Katrina was a 250-year storm for the New Orleans area.

Since 2005, the Army Corps has revamped the storm protection system’s 350 miles of levees and floodwalls, 73 pumping stations, three canal-closure structures, and four gated outlets. The corps built a much-heralded 26-foot-high, 1.8-mile surge barrier in Lake Borgne, about 12 miles east of the center of the city.

During Katrina, a 15- to 16-foot-high storm surge in Lake Borgne forced its way into the Intracoastal Waterway, putting pressure on the Industrial Canal levees that breached and caused catastrophic flooding in the city’s Lower 9th Ward.

“In New Orleans, we know that no matter how high we build this or how wide we build it, eventually there will be a storm that’s able to overtop it,” New Orleans District Army Corps spokesman Ricky Boyett says, admiring the immense surge barrier from a boat on Lake Borgne. “What we want is this to be a strong structure that will be able to withstand that with limited to no damage from the overtopping.” (4)

500 Year Floods

Hurricane Harvey brought an immense amount of extreme rain, which brought a record 64″ in one storm to the Houston metropolitan region. This is a staggering amount of water, over 5 feet in height, this amount of water could only overwhelm low-lying areas, and depressions in topography. Flash floods can happen during extreme storms, where a drainage system is designed for a 1:100 year flood event, and not for a 1:500 or 1:1000 year flood event. Road ways can easily become rivers as drainage systems back up and surface water has no place to collect.

500-year-floods

Figure 1. 500 year flood events in the USA since 2015 (5)

New standards in development may need to accommodate more stringent standards. Existing municipal drainage systems are not designed to handle extreme rain and other means of drainage systems may have to be developed to divert water away from centers of population. Communities will be built to new standards, where storm water management is given a higher priority to avert flooding.

BN-UX285_HARVEY_M_20170831100012

Figure 2. Floodwaters from Tropical Storm Harvey (6)

Given the future uncertainty of our climate and weather, we cannot continue to ignore the devastating effects that disasters have on cities and regions. We must ask some difficult questions regarding the intelligence of continuing to build and live in increasingly higher risk regions.

On a personal level every citizen must take some responsibility in their choices of where to live. As for governments they need to decide how best to allocate limited resources in rebuilding and upgrading storm protection systems. It is anticipated that some areas will be abandoned as risks become too high for effective protection from future storm events.

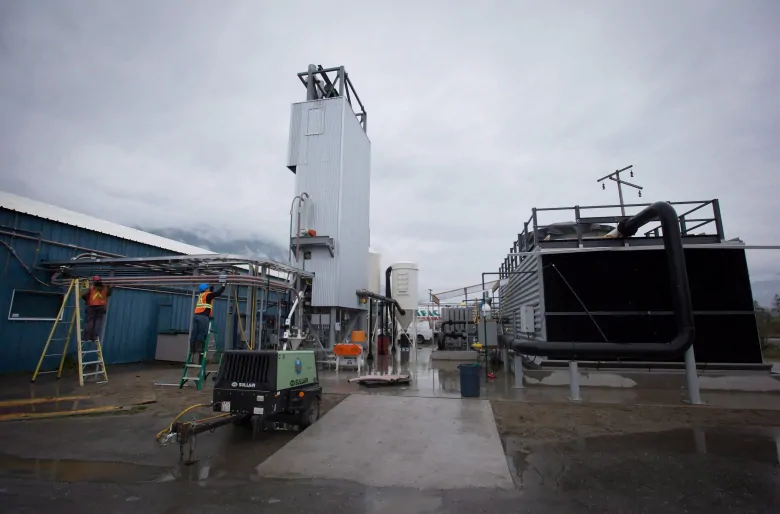
The Oil and Gas Industry

It seems there is an irony involved with the possibility that storms severity is linked to global warming, and that access to vulnerable regions often are in part economically driven by the oil and gas industry.  Hurricane Harvey is the most recent storm which is affecting fuel prices across the USA. Refinery capacity has shrunk due to plant shut-downs.  Shortages in local fuel supplies are occurring, as remaining gasoline stations run dry.

Goldman Sachs estimates that the hurricane has taken 3 million barrels a day — or about 17% — of refining capacity offline, and that’s likely to increase the overall level of crude-oil inventories over the next couple of months. (7)

Oil and gas are particularly vulnerable to exposure to the weather, and it is in their own best interests to provide local protection to the area so that they can continue extracting the resource. However, ancillary industries such as refining may better be served by relocation away from danger areas. Also, supply lines become choked by disaster, and can potentially have consequences beyond the region which was exposed to the disaster.

The Electric Vehicle in the Smart City

Such events can only put upward pressure on the price of fuel, while providing further incentive to move away from the internal combustion engine as means of motive power. Electric vehicles would provide a much better ability to recover quickly from storm events as they are not restricted by access to fuel. Micro-grids in cities provide sectors of available power for which electric emergency response vehicles can move.

By moving reliance away from carbon based fuels to renewable electric sources and energy storage, future development in cities may see the benefits inherent in the electric vehicle. Burning fuels create heat, water and carbon dioxide in the combustion process. They consume our breathable oxygen and pollute the atmosphere. Pipelines, tankers and rail cars can break and spill causing pollution. Exploration causes damage to the environment.

A city that is energy efficient and reliant on renewable sources of energy that benignly interact with the environment can approach self-sustainability and a high degree of resilience against disaster. This combined with designing to much higher standards which keep in mind the current volatility our climate is experiencing, and uses the lessons learned in other areas as indicators of best practices into the future.


References

  1. Hurricane Harvey Damages Could Cost up to $180 Billion
  2. Global warming is ‘causing more hurricanes’
  3. “3 Performance of Coastal Risk Reduction Strategies.” National Research Council. 2014. Reducing Coastal Risk on the East and Gulf Coasts. Washington, DC: The National Academies Press. doi: 10.17226/18811.
  4. Rising Sea Levels May Limit New Orleans Adaptation Efforts
  5. Houston is experiencing its third ‘500-year’ flood in 3 years. How is that possible?
  6. Hurricane Harvey Slams Texas With Devastating Force
  7. GOLDMAN: Harvey’s damage to America’s oil industry could last several months

An Engineer’s Take On Major Climate Change

Summary:
1. Climate science is very complicated and very far from being settled.

2. Earth’s climate is overwhelmingly dominated by negative-feedbacks that are currently poorly represented in our Modeling efforts and not sufficiently part of ongoing investigations.

3. Climate warming drives atmospheric CO2 upward as it stimulates all natural sources of CO2 emission. Climate cooling drives atmospheric CO2 downward.

4. Massive yet delayed thermal modulations to the dissolved CO2 content of the oceans is what ultimately drives and dominates the modulations to atmospheric CO2.

5. The current spike in atmospheric CO2 is largely natural (~98%). i.e. Of the 100ppm increase we have seen recently (going from 280 to 380ppm), the move from 280 to 378ppm is natural while the last bit from 378 to 380ppm is rightfully anthropogenic.

6. The current spike in atmospheric CO2 would most likely be larger than now observed if human beings had never evolved. The additional CO2 contribution from insects and microbes (and mammalia for that matter) would most likely have produced a greater current spike in atmospheric CO2.

7. Atmospheric CO2 has a tertiary to non-existent impact on the instigation and amplification of climate change. CO2 is not pivotal. Modulations to atmospheric CO2 are the effect of climate change and not the cause.

Watts Up With That?

Guest essay by Ronald D. Voisin

Let’s examine, at a high and salient level, the positive-feedback Anthropogenic Global Warming, Green-House-Gas Heating Effect (AGW-GHGHE) with its supposed pivotal role for CO2. The thinking is that a small increase in atmospheric CO2 will trigger a large increase in atmospheric Green-House-Gas water vapor. And then the combination of these two enhanced atmospheric constituents will lead to run-away, or at least appreciable and unprecedented – often characterized as catastrophic – global warming.

This theory relies entirely on a powerful positive-feedback and overriding (pivotal) role for CO2. It further assumes that rising atmospheric CO2 is largely or even entirely anthropogenic. Both of these points are individually and fundamentally required at the basis of alarm. Yet neither of them is in evidence whatsoever. And neither of them is even remotely true. CO2 is not only “not pivotal” but it…

View original post 4,012 more words

What Does Moist Enthalpy Tell Us?

“In terms of assessing trends in globally-averaged surface air temperature as a metric to diagnose the radiative equilibrium of the Earth, the neglect of using moist enthalpy, therefore, necessarily produces an inaccurate metric, since the water vapor content of the surface air will generally have different temporal variability and trends than the air temperature.”

Climate Science: Roger Pielke Sr.

In our blog of July 11, we introduced the concept of moist enthalpy (see also Pielke, R.A. Sr., C. Davey, and J. Morgan, 2004: Assessing “global warming” with surface heat content. Eos, 85, No. 21, 210-211. ). This is an important climate change metric, since it illustrates why surface air temperature alone is inadequate to monitor trends of surface heating and cooling. Heat is measured in units of Joules. Degrees Celsius is an incomplete metric of heat.

Surface air moist enthalpy does capture the proper measure of heat. It is defined as CpT + Lq where Cp is the heat capacity of air at constant pressure, T is air temperature, L is the latent heat of phase change of water vapor, and q is the specific humidity of air. T is what we measure with a thermometer, while q is derived by measuring the wet bulb temperature (or, alternatively, dewpoint…

View original post 203 more words

Twelve Reasons Why Globalization is a Huge Problem

Globalization seems to be looked on as an unmitigated “good” by economists. Unfortunately, economists seem to be guided by their badly flawed models; they miss  real-world problems. In …

Source: Twelve Reasons Why Globalization is a Huge Problem

The “fuel” that’s helping America fight climate change isn’t natural gas

Power for the People VA

You’ve heard the good news on climate: after a century or more of continuous rise, U.S. CO2 emissions have finally begun to decline, due largely to changes in the energy sector. According to the Energy Information Agency (EIA), energy-related CO2 emissions in 2015 were 12% below their 2005 levels. The EIA says this is “because of the decreased use of coal and the increased use of natural gas for electricity generation.”

Is the EIA right in making natural gas the hero of the CO2 story? Hardly. Sure, coal-to-gas switching is real. But take a look at this graph showing the contributors to declining carbon emissions. Natural gas displacement of coal accounts for only about a third of the decrease in CO2 emissions.

Courtesy of the Sierra Club Beyond Coal Campaign, using data from the Energy Information Agency. Courtesy of the Sierra Club Beyond Coal Campaign, using data from the Energy Information Agency.

By far the biggest driver of the declining emissions is energy efficiency. Americans…

View original post 746 more words

Urbane Legends

Is Climate Change an Urban Legend?

US Issues

By Willis Eschenbach – Re-Blogged From http://www.WattsUpWithThat.com

So we were sitting around the fire at the fish camp on the Colombia a few days ago, and a man said “Did you hear about the scientific study into meat preservatives?” We admitted our ignorance, and he started in. The story was like this:

“A few years ago there was a study done by some University, I can’t remember which one, but it was a major one. What they did was to examine the corpses of people who had died in Siberia, and those that had died in Washington State. Now of course the people in Siberia weren’t eating meat preservatives during their lives, and the Washington people were eating them. And when they dug up the graves and looked at the bodies, guess what they found?” 

the killer in the back seatUrban Legend: The Killer In The Back Seat SOURCE 

View original post 1,264 more words

Massive Methane Gas Leak at California Storage Facility

The natural gas leak from a storage facility in the hills above Los Angeles is shaping up as a major ecological disaster as it vents large amounts of methane, a potent greenhouse gas.

Sourced through Scoop.it from: www.washingtonpost.com

” […]  A runaway natural gas leak from a storage facility in the hills above Los Angeles is shaping up as a significant ecological disaster, state officials and experts say, with more than 150 million pounds of methane pouring into the atmosphere so far and no immediate end in sight.

The rupture within a massive underground containment system — first detected more than two months ago — is venting gas at a rate of up to 110,000 pounds per hour, California officials confirm. The leak already has forced evacuations of nearby neighborhoods, and officials say pollutants released in the accident could have long-term consequences far beyond the region.

Newly obtained infrared video captures a plume of gas — invisible to the naked eye — spouting from a hilltop in the Aliso Canyon area above Burbank, like smoke billowing from a volcano. Besides being an explosive hazard, the methane being released is a powerful greenhouse gas, more potent than carbon dioxide in trapping heat in the lower atmosphere.

Scientists and environmental experts say the Aliso Canyon leak instantly became the biggest single source of methane emissions in all of California when it began two months ago. The impact of greenhouse gases released since then, measured over a 20-year time frame, is the equivalent of emissions from six coal-fired power plants or 7 million automobiles, environmentalists say. […]

See on Scoop.itGreen & Sustainable News