
…while the energy consumption of Earth is still increasing, there is another trend where the energy intensity (the amount of energy needed to produce one unit of GDP) is decreasing.
…while the energy consumption of Earth is still increasing, there is another trend where the energy intensity (the amount of energy needed to produce one unit of GDP) is decreasing.
In the beginning, the Master Economist created the Economy. He created businesses large and small, consumers, governments with their regulation, and financial institutions of all types. And the Ma…

Source: How Energy Shapes the Economy
To begin, let us ask what is energy efficiency, what are it’s components and how is it measured. To make comparisons we need to gather data using measures relevant to the industry in question, also to the input forms of energy, waste streams and the useful work performed. In the case of a building we may use meters to measure consumption or utility bills and compare changes in consumption rates over time.
To an engineer, energy efficiency is the ratio of useful work over total energy input. For example, a room air conditioner’s efficiency is measured by the energy efficiency ratio (EER). The EER is the ratio of the cooling capacity (in British thermal units [Btu] per hour) to the power input (in watts).
On a grander scale we may be looking improvements over an industry or sector, changing fuel types in a utility such as the conversion of a coal plant to the production of power fueled by natural gas to reduce the carbon load on the environment. Efficiency may be measured by different metrics depending on the result sought and may include the environmental impact of waste streams.
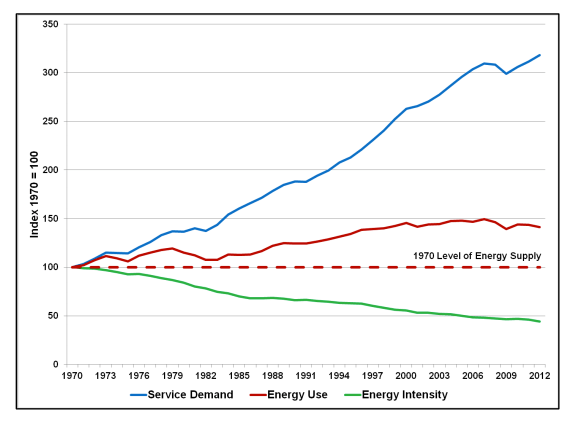
Figure 1: Historical Energy Use Graph (1)
Whatever the exact yearly investment figure, the historical economic impact of efficiency is quite clear. As the graph () shows, efficiency has provided three times more of the economic services than new production since 1970:
The blue line illustrates demand for energy services (the economic activity associated with energy use) since 1970; the solid red line shows energy use; and the green line illustrates the gain in energy efficiency. While demand for energy services has tripled in the last four decades, actual energy consumption has only grown by 40 percent. Meanwhile, the energy intensity of our economy has fallen by half.
The area between the solid red line and the blue line represents the amount of energy we did not need to consume since 1970; the area between the dashed red line and the solid red line indicates how much energy we consumed since 1970.
The chart shows that energy efficiency met nearly three quarters of the demand for services, while energy supply met only one quarter.
“One immediate conclusion from this assessment is that the productivity of our economy may be more directly tied to greater levels of energy efficiency rather than a continued mining and drilling for new energy resources,” wrote Laitner. (1)
As noted in an article by the EIA; The central question in the measurement of energy efficiency may really be “efficient with respect to what?” (2) In general terms when discussing energy efficiency improvements we mean to perform more of a function with the same or less energy or material input.
Energy efficiency measures are those improvement opportunities which exist in a system which when taken will achieve the goals of achieving greater performance. For example refer to Table 1 of Energy Efficiency Measures which can be effectively reduce energy consumption and provide an ROI of 5 or less years when applied to the commercial refrigeration industry.

Table 1: Commercial Refrigeration Energy Efficiency Measures (3)
Energy efficiency has been put forward as one of the most effective methods in efforts to address the issue of Climate Change. Recently, on February 19, 2015, President Obama signed Executive Order (EO) 13693.
“Since the Federal Government is the single largest consumer of energy in the Nation, Federal emissions reductions will have broad impacts. The goals of EO 13693 build on the strong progress made by Federal agencies during the first six years of the Administration under President Obama’s 2009 Executive Order on Federal Leadership on Environmental, Energy and Economic Performance, including reducing Federal GHG emissions by 17 percent — which helped Federal agencies avoid $1.8 billion in cumulative energy costs — and increasing the share of renewable energy consumption to 9 percent.
With a footprint that includes 360,000 buildings, 650,000 fleet vehicles, and $445 billion spent annually on goods and services, the Federal Government’s actions to reduce pollution, support renewable energy, and operate more efficiently can make a significant impact on national emissions. This EO builds on the Federal Government’s significant progress in reducing emissions to drive further sustainability actions through the next decade. In addition to cutting emissions and increasing the use of renewable energy, the Executive Order outlines a number of additional measures to make the Federal Government’s operations more sustainable, efficient and energy-secure while saving taxpayer dollars. Specifically, the Executive Order directs Federal agencies to:
– Ensure 25 percent of their total energy (electric and thermal) consumption is from clean energy sources by 2025.
– Reduce energy use in Federal buildings by 2.5 percent per year between 2015 and 2025.
– Reduce per-mile GHG emissions from Federal fleets by 30 percent from 2014 levels by 2025, and increase the percentage of zero emission and plug in hybrid vehicles in Federal fleets.
– Reduce water intensity in Federal buildings by 2 percent per year through 2025. ” (4)
Energy efficiency has gained recognition as a leading method to reduce the emissions of GHG’s seen to be the cause of climate change. Under scrutiny, we find that there are different measures of efficiency across different industry, fuel types and levels. For example on a micro-level, the functioning of a system may be improved by including higher efficiency components in it’s design, such as motors and pumps.
However, there are other changes which can improve efficiency. Adding automated computer controls can improve a system level efficiency. Utilities may change from coal burning to natural gas fired power plants, or industry may convert to a process to include for co-generation. Battery storage and other technological improvements may come along to fill in the gap.
Historically Energy Efficiency measures have proven to be gaining ground by employing people with the savings earned when applying measures to reduce consumption. These savings reverberate through the economy in a meaningful way, by reducing the need for the construction of more power plants as one example as we on an individual level. We consume less energy, and using higher efficiency electronic equipment, and other energy savings measures at a consumer level, our communities are capable of more growth with existing energy supplies.
jEnergy production and consumption, as well as population growths also arise to other issues related to energy consumption, such as water consumption, water waste, and solid material waste. Building with sustainable materials which promote healthy living environments is gaining importance as we understand the health impacts of a building’s environment on the health and well-being of the occupants. Energy efficiency in the modern era, as we see from recent government mandates and sustainability programs, such as LEED’s for one, also includes for reductions in water intensity and incorporation of renewable energy programs as an alternative to increasing demand on existing utilities.
Related Blog Posts:
References
The purpose of this brief is to investigate into the types of solar panel systems with a look at their theoretical maximum Energy Conversion Efficiency both in research and the top 20 manufactured commercial PV panels.
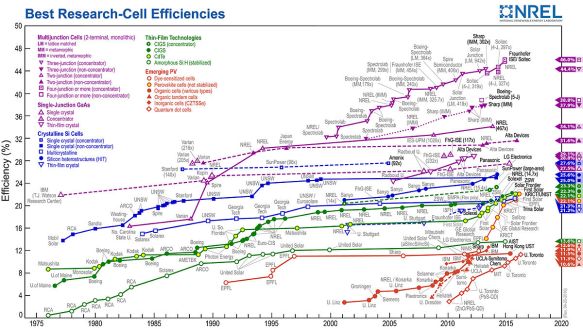
Figure 1: Reported timeline of solar cell energy conversion efficiencies since 1976 (National Renewable Energy Laboratory) (1)
Solar panel efficiency refers to the capacity of the panel to convert sunlight into electricity. “Energy conversion efficiency is measured by dividing the electrical output by the incident light power.” (1) There is a theoretical limit to the efficiency of a solar cell of “86.8% of the amount of in-coming radiation. When the in-coming radiation comes only from an area of the sky the size of the sun, the efficiency limit drops to 68.7%.”
Figure 1 shows that there has been considerable laboratory research and data available on the various configurations of photo-voltaic solar cells and their energy conversion efficiency from 1976 to date. One major advantage is that as PV module efficiency increases the amount of material or area required (system size) to maintain a specific nominal output of electricity will generally decrease.
Of course, not all types of systems and technologies are economically feasible at this time for mainstream production. The top 20 PV solar cells are listed in Figure 2 below with their accompanying measured energy efficiency.

Figure 2: Table of the top 20 most efficient solar panels on the North American Market (2)
Current technology has the most efficient solar PV modules composed of monocrystalline silicon. Lower efficiency panels are composed of polycrystalline silicon and are generally about 13 to 16% efficient. This lower efficiency is attributed to higher occurrences of defects in the crystal lattice which affects movement of electrons. These defects can be imperfections and impurities, as well as a result of the number of grain boundaries present in the lattice. A monocrystal by definition has only grain boundaries at the edge of the lattice. However a polycrystalline PV module is full of grain boundaries which present additional discontinuities in the crystalline lattice; impeding electron flow thus reducing conversion efficiency. (3) (4)
Direction and angle of your roof
Your roof will usually need to be South, East or West facing and angled between 10 and 60 degrees to work at its peak efficiency.
Shade
The less shade the better. Your solar panels will have a lower efficiency if they are in the shade for significant periods during the day.
Temperature
Solar panel systems need to be installed a few inches above the roof in order to allow enough airflow to cool them down. Cooler northern climates also improve efficiency to partially compensate for lower intensity.
Time of year
Solar panels work well all year round but will produce more energy during summer months when the sun is out for longer. In the far northern regions the sun can be out during the summer for most of the day, conversely during the winter the sun may only be out for a few hours each day.
Size of system
Typical residential solar panel systems range from 2kW to 4kW. The bigger the system the more power you will be able to produce. For commercial and larger systems refer to a qualified consultant.

Figure 1: Projected Job Growth by Sectors – Green Economy Report, 2011 (1)
“WASHINGTON – The U.S. Department of Energy today released the agency’s first annual analysis of how changes in America’s energy profile are affecting national employment in multiple energy sectors. By using a combination of existing energy employment data and a new survey of energy sector employers, the inaugural U.S. Energy and Employment Report (USEER) provides a broad view of the national current energy employment landscape.
USEER examines four sectors of the economy — electric power generation and fuels; transmission, wholesale distribution, and storage; energy efficiency; and motor vehicles — which cumulatively account for almost all of the United States’ energy production and distribution system and roughly 70 percent of U.S. energy consumption. By looking at such a wide portion of the energy economy, USEER can provide the public and policy makers with a clearer picture of how changes in energy technology, systems, and usage are affecting the economy and creating or displacing jobs.
Some key findings of the report include:
3.64 million Americans work in traditional energy industries, including production, transmission, distribution, and storage.
Of these, 600,000 employees contribute to the production of low-carbon electricity, including renewable energy, nuclear energy and low emission natural gas.
An additional 1.9 million Americans are employed, in whole or in part, in energy efficiency.
Roughly 30 percent of the 6.8 million employees in the U.S. construction industry work on energy or building energy efficiency projects.
A copy of the full report is available HERE.
The report also found several energy industries with projected increases in new jobs. Responding to the USEER survey of employers, the energy efficiency sector predicted hiring rates of 14 percent in 2016, or almost 260,000 new hires. Projected hiring rates were at 5 percent within the electric power generation and fuels sector, reflecting overall growth despite a loss of employment in 2015 in the oil and natural gas extraction sectors. Transmission, wholesale distribution, and storage firms anticipate 4 percent employment growth in 2016. Solar energy firms predicted 15 percent job growth over the next year.
Yet even as the report found the opportunity for job growth in many energy sectors, over 70 percent of all employers surveyed found it “difficult or very difficult” to hire new employees with needed skills.
“The transformation of our energy system and the growth of energy efficiency technologies are creating opportunities for thousands of new jobs, especially in energy efficiency and solar,” said David Foster, Senior Advisor on Energy and Industrial Policy at the Department of Energy. “This report gives an important snapshot of energy employment in America, and subsequent reports will provide better information to guide policies and priorities that create new jobs, appropriately train workers, and promote a successful national energy policy.” …” (1)
“…As a rule of thumb, investment in renewable energy and energy efficiency generate about 3 times the amount of jobs that other energy related investments create (gas, oil, coal, nuclear). Average numbers of jobs created per million euro invested (3CSEP):
[…] (2)

Figure 2: Job Generators Comparison Chart (3)
“[…] While much of the debate on climate change and employment has focused on renewables, another and more significant source of jobs from decarbonization has received much less attention. Substantial efficiency gains are technically feasible and economically viable in industry, housing, transportation, and services. Businesses can make a profit and households can enjoy real savings. And spending the surplus on things other than fossil energy will boost an economy’s employment.
For example, the United States is a diversified economy that imports substantial amounts of equipment for renewables. A recent study carefully considered economy-wide effects of reducing emissions by 40 percent by 2030 through a mix of clean energy and energy efficiency (Pollin and others, 2014). It concluded that $200 billion a year in investment would generate a net gain of about 2.7 million jobs: 4.2 million in environmental goods and service sectors and their supply chains but 1.5 million lost in the shrinking fossil- and energy-intensive sectors. The net gain of 2.7 million jobs would reduce the unemployment rate in the 2030 U.S. labor market by about 1.5 percentage points—for example, from 6.5 percent to 5 percent. The authors consider this a conservative estimate; for example, it does not take into account the 1.2 to 1.8 million jobs likely gained from reinvested savings.
Other studies show similar results. A review of 30 studies covering 15 countries and the European Union as a whole found appreciable actual or potential net gains in employment (Poschen, 2015). Most studies considering emission targets in line with the ambitions announced for a Paris agreement in December find net gains on the order of 0.5 to 2.0 percent of total employment, or 15 million to 60 million additional jobs. In emerging market economies such as Brazil, China, Mauritius, and South Africa, green investment was found to accelerate economic growth and employment generation when compared with business as usual. Several studies suggest that more ambitious climate targets would generate greater gains in employment (for a discussion of particular countries, see Poschen, 2015). […]” (3)
(1) http://bit.ly/1RsVAdc
(2) http://1.usa.gov/1Tby7lt
(3) http://bit.ly/1RlUaV8
“GE has announced it is working on a way to use CO2 pollution to make new types of solar batteries that could each power up to 100,000 homes. CO2 is the main contributor to climate change, and is released into the atmosphere when coal is processed at power plants. Currently environmental procedures mean that some CO2 from these plants is captured and stored, so it’s not released back into the atmosphere. But the question has always been: What do you do with the stored gas?” (1)

Figure #1: Comparison of 10 MWe Turbines (2)
What are the Benefits of Supercritical CO2? With the transition from steam generation to using Supercritical CO2 as a working fluid, we seen large gains in energy efficiency conversion, coupled with significant size (footprint) reduction of turbomachines. Other benefits include sequestering CO2 from the environment and reducing GHG emissions. Also, this system can be utilized to capture energy from other heat sources including waste heat streams and co-generation applications.

Figure 2: Relative size comparison of steam, helium and supercritical CO2 turbomachinery for Generation IV Nuclear Reactors (3)
What is Supercritical CO2? “[…] Supercritical CO2 is a fluid state of carbon dioxide where it is held above its critical pressure and critical temperature which causes the gas to go beyond liquid or gas into a phase where it acts as both simultaneously. Many fluids can achieve supercritical states and supercritical steam has been used in power generation for decades. Supercritical CO2 has many unique properties that allow it to dissolve materials like a liquid but also flow like a gas. sCO2 is non-toxic and non-flammable and is used as an environmentally-friendly solvent for decaffeinating coffee and dry-cleaning clothes.

Figure 3: CO2 phase diagram illustrating supercritical region. (4)
The use of sCO2 in power turbines has been an active area of research for a number of years, and now multiple companies are bringing early stage commercial products to market. The attraction to using sCO2 in turbines is based on its favorable thermal stability compared to steam which allows for much higher power outputs in a much smaller package than comparable steam cycles. CO2 reaches its supercritical state at moderate conditions and has excellent fluid density and stability while being less corrosive than steam. The challenges in using sCO2 are tied to identifying the best materials that can handle the elevated temperatures and pressures, manufacturing turbo machinery, valves, seals, and of course, costs. […] ” (2)
How will this work?
“[…] The design has two main parts. The first one collects heat energy from the sun and stores it in a liquid of molten salt. “This is the hot side of the solution,” Sanborn says. The other component uses surplus electricity from the grid to cool a pool of liquid CO2 so that it becomes dry ice.
During power generation, the salt releases the heat to expand the cold CO2 into a supercritical fluid, a state of matter where it no longer has specific liquid and gas phases. It allows engineers to make the system more efficient.
The supercritical fluid will flow into an innovative CO2 turbine called the sunrotor, which is based on a GE steam turbine design. Although the turbine can fit on an office shelf (see image above) it can generate as much as 100 megawatts of “fast electricity” per installed unit—enough to power 100,000 U.S. homes.
Sanborn believes that a large-scale deployment of the design would be able to store “significant amounts” of power —— and deliver it back to the grid when needed. “We’re not talking about three car batteries here,” he says. “The result is a high-efficiency, high-performance renewable energy system that will reduce the use of fossil fuels for power generation.”
He says the system could be easily connected to a solar power system or a typical gas turbine. The tanks and generators could fit on trailers. His goal is to bring the cost to $100 per megawatt-hour, way down from the $250 it costs to produce the same amount in a gas-fired power plant. “It is so cheap because you are not making the energy, you are taking the energy from the sun or the turbine exhaust, storing it and transferring it,” says Sanborn.
The process is also highly efficient, Sanborn says, yielding as much as 68 percent of the stored energy back to the grid. The most efficient gas power plants yield 61 percent. The team is now building a conceptual design, which Sanborn believes could take five to 10 years to get from concept to market. […]” (5)
Read more at:
1. https://duanetilden.com/2013/10/29/supercritical-co2-refines-cogeneration-for-industry/
References:

Originally published on Solar Love. A new study has concluded that utility-scale solar PV systems across the US are “significantly” more cost effective than rooftop solar PV systems. Sp…
Sourced through Scoop.it from: cleantechnica.com
“[…] the study, conducted by economists at global consulting firm The Brattle Group, found that utility-scale solar PV systems were more cost effective at achieving the economic and policy benefits of PV solar than rooftop or residential-scale solar was.
The study, Comparative Generation Costs of Utility-Scale and Residential-Scale PV in Xcel Energy Colorado’s Service Area, published Monday, is the first of its kind to study a “solar on solar” comparison.
“Over the last decade, solar energy costs for both rooftop and bulk-power applications have come down dramatically,” said Dr. Peter Fox-Penner, Brattle principal and co-author of the study. “But utility-scale solar will remain substantially less expensive per kWh generated than rooftop PV. In addition, utility-scale PV allows everyone access to solar power. From the standpoint of cost, equity, and environmental benefits, large-scale solar is a crucial resource.”
The study yielded two key findings:
The report itself was commissioned by American thin-film photovoltaic manufacturer and utility scale developer First Solar with support from Edison Electric Institute, while Xcel Energy Colorado provided data and technical support. Specifically, the report examined the comparative customer-paid costs of generating power from equal amounts of utility-scale and residential/rooftop-scale solar PV panels in the Xcel Energy Colorado system.
A reference case and five separate scenarios with varying degrees of investment tax credit, PV cost, inflation, and financing parameters were used to yield the report’s results.
The specifics of the study’s findings, which imagined a 2019 Xcel Energy Colorado system, are as follows:
The authors of the report put these figures into perspective, including the national average for retail all-in residential electric rates in 2014, which were 12.5¢/kWh. […]”
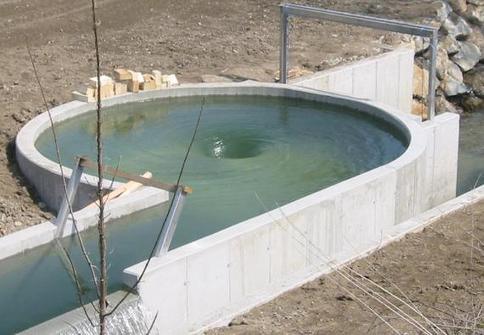
Photo: Top Viewed Article of the year on Water Vortex Hydro-Electric Power Plant Designs
This is going to be a fun post to write, as I get to review the statistics for 2015 and pick out the ten most viewed posts on my blog for the year. I am looking forward to performing this review, as I get to find out what works and what does not. The idea being to give me a chance to refine my techniques and improve my blog posts.
I am listing them in reverse order as we want to heighten the suspense, leading up to the most viewed article. Each post will also have the posting date and number of views for comparison. I know this technique is not perfect as some posts will have a longer opportunity to be seen than those written later in the year. Such discrepancies will be left to discussed in a future article.

This post discusses Earth’s wandering magnetic poles, the fluctuating field strengths and links to solar weather and climate change. Some rather eccentric, yet plausible explanations based on historical data that pole shifts are possible and have happened, at unpredictable, largely spaced intervals of hundreds of thousands to millions of years, the average being 450,000 years.
Posted on March 3, 2015 and received 44 views.

Headline tells it all. Large bank caught helping clients evade taxes and launder illegally obtained money through bank accounts.
Posted on February 9, 2015 and received 48 views.

Coal is unclean to burn and becoming costly to do operate due to emissions, resulting in coal fired plant closures, 9 by one Michigan utility.
Posted on February 10, 2015 and received 50 views.

This article simply reprises, in part, the LCCA (Life-Cycle Cost Analyisis) procedure used for buildings as originally posted by WBDG.
Posted on February 15, 2015 and received 57 views.

The article discusses the role of large scale energy efficiency programs as an investment and means to achieve certain goals when viewed as the “cheapest” fuel. The graphic depicts a hierarchy of waste minimization correlating to cost and energy usage and effects with the environmental resources.
Posted on January 8, 2015 and received 59 views.

According to the latest “Energy Infrastructure Update” report from the Federal Energy Regulatory Commission’s (FERC) Office of Energy Projects, renewable energy sources (i.e., biomass, geothermal, hydroelectric, solar, wind) provided nearly half (49.81 percent – 7,663 MW) of new electrical generation brought into service during 2014 while natural gas accounted for 48.65 percent (7,485 MW).
Posted on February 4, 2015 and received 62 views.

Tens of thousands of Fukushima residents remain in temporary housing more than four years after the horrific disaster of March 2011. Some areas on the outskirts of Fukushima have officially reopened to former residents, but many of those former residents are reluctant to return home because of widespread distrust of government claims that it is okay and safe.
Posted on July 22, 2015 and received 65 views.

The company plans to employ 150 full-time Apple staff at the Mesa, Arizona, facility… In addition to the investment for the data center, Apple plans to build a solar farm capable of producing 70-megawatts of energy to power the facility. […] Apple said it expects to start construction in 2016 after GT Advanced Technologies Inc., the company’s sapphire manufacturing partner, clears out of the 1.3 million square foot site.
Posted on February 11, 2015 and received 73 views.

With regard to [battery] energy storage systems, many people erroneously think that the only cost they should consider is the initial – that is, the cost of generating electricity per kilowatt-hour. However, they are not aware of another very important factor. This is the so-called LCOE, levelized cost of energy (also known as cost of electricity by source), which helps calculate the price of the electricity generated by a specific source.
Posted on January 27, 2015 and received 109 views.

Austrian engineer Franz Zotlöterer has constructed a low-head power plant that makes use of the kinetic energy inherent in an artificially induced vortex. The water’s vortex energy is collected by a slow moving, large-surface water wheel, making the power station transparent to fish – there are no large pressure differences built up, as happens in normal turbines.
Posted on June 11, 2015 and received 109 views.
Author: Duane M. Tilden, P.Eng (January 14th, 2016)
Abstract: Energy sources and pricing are hot topics world-wide with the Climate Change agenda leading the way. Last year at the 2015 Paris Climate Conference long-term goal of emissions neutrality was established to be by as soon as 2050. Alberta currently produces more atmospheric carbon emissions and other pollutants than any other Province in Canada, and in order to meet clean air objectives the energy sectors which consume & mine the natural resources of the Province will have to shift to non-polluting & renewable energy sources and be more efficient in energy utilization. To achieve these goals new infrastructure will have to be built which will have the likely consequences of raising energy pricing as well as alter consumption rates and patterns.
Transportation is a vital link in modern society, and often a personal vehicle is chosen as the main mode of mobility to work, leisure, & social purposes. Cars and trucks also provide means of work and commerce & are essential to our way of life. Most of these vehicles are fueled by gasoline, some by diesel, propane, and more recently the electric vehicle (EV) and hybrids.

Graph #1: Average Cost Comparison of Gasoline in Major Canadian Cities
In Alberta, using Calgary as a basis for comparison, it is apparent that pricing to consumers for gasoline is below nation-wide market averages when measured Province by Province, as demonstrated in Graph #1 (1). While if you live in Vancouver the cost is considerably higher, due to included carbon taxes and a transit levy among additional charges. Additional means of moving growing populations efficiently have been seen by the development of LRT mass transit for the rapid movement of citizens to work, school, or social events.
Rapidly moving the large segments of the population in a cost effective manner is important to growth. Buses are an important link in this mix as are cycling routes, green-ways and parks. Changes in fuels for trucks, buses and trains by converting from diesel fuel to LNG will also provide for reductions in emissions while providing economic opportunity for utilization of the existing plentiful resource. While EV’s show promise, the battery technologies for energy storage need further development.
Alberta still relies on out-dated coal plants to generate electricity. According to a CBC article coal provides power to 55% of homes in Alberta, and is the second largest contributor to emissions (2) and GHG’s to the Oil Sands projects. However, it has been noted that the utility is reluctant to decommission recently constructed coal plants, until they have earned back (or are compensated for) their investment in capital costs.

Photo #1: Highvale coal mine to feed the nearby Sundance power plant (3)
Photo credit: John Lucas / Edmonton Journal
There are power purchase agreements in place, which may extend 50 to 60 years from the construction date of the plant (2). It may be possible that the coal fired power plants could be converted to burn natural gas, which Alberta has in abundance, rather than be decommissioned. However, this would still require the closure of the coal mines and mining operations currently supplying the existing power plants. Also, combustion of natural gas will still release GHG’s into the atmosphere, while less than coal, they are not a total elimination of emissions.
When comparing monthly residential electrical energy costs across Canada, using data obtained from a survey performed by Manitoba Hydro, we see that Edmonton and Calgary are in the lower middle range of pricing (4). Variances in all regions will occur based on average home size, building codes and insulation requirements, heating system types and other factors. Some homes may be heated with electric baseboard which will result in a higher electric bill while other homes may be heated using natural gas as a fuel. Also household hot water generation can be by electric or gas-fired heater, so consumption of natural gas must be considered with electrical power usage to get a complete picture of energy consumption.


Charts #1 & 2: Average Monthly Cost For Residential Electricity in Major Canadian Cities For Equivalent Usage in kWh (4)
Inspecting these charts it is proposed that a price increase of 10 to 20% to Alberta electrical energy consumers by a separate tax or fee to pay for a shift in technology would be reasonable when compared to other Canadian Cities. Additional tariffs on natural gas consumption would also be recommended. Such an increase would likely have a secondary benefit of creating an incentive for energy efficiency upgrades by home owners such as increased insulation, better windows and heating system upgrades. Such improvements would in turn lead to reduced demand at the source and thus to lower GHG & particulate emissions to the atmosphere.
Energy consumption in populations is normalized in a number of ways, generally defined by habits and patterns. We observe that in traffic as volumes increase early in the morning as commuters travel to work, and in the opposite direction as they head home in the evening. Often people will attempt to “beat the traffic”. This is an admirable goal in energy usage as well, for consumption of electricity will follow other such predictable patterns as people eat meals, shower, and perform other rituals that interface with electrical, heating, ventilating, elevators, water supply and disposal systems that form infrastructure and services provided by municipalities and utilities.
As these systems need to be energized and maintained, it is desirable to be able to predict and control the consumption and distribution of resources. The greater of these is the electrical generation and distribution system. Also, emerging technological advancements in energy efficiency such as CFL, LCD displays, computers, refrigeration, energy storage and more. Advancements in co-generation, district energy systems, and other end use distribution of energy which provide economies of scale are also possible as strategies to obtain goals.
Map #1: Partial Map of Heating Degree Days for South-Western Canada (5)
Opportunities will exist for building mechanical system enhancements and upgrades as they may provide energy savings and cost reductions to users often calculated with a minimum nominal payback period of 5 to 7 years (and should be determined in every case). The HDD map can provide a source of information which is used in energy models to determine predicted building energy costs when calculating payback periods to justify system upgrades or design decisions. Obtaining and monitoring building energy consumption rates and year over year changes are important resources in determining where systems are running at below optimal rates and require replacement.
In new building construction the National Energy Code for Buildings 2011 (NECB) (6) has been adopted by Alberta (7) for all municipalities. As there are higher HDD values attributed to Calgary and Edmonton as seen in the HDD Map of Western Canada, a requirement for stringent construction methods and materials to higher standards ensure new buildings meet carbon emissions reduction goals.

Photo #2: Construction of Towers in Calgary with High Window to Wall Ratios
Photo Credit: Duane Tilden P.Eng
Increased requirements in glass U-values and shading coefficients, maximum window to wall ratios (WWR) to reduce undesirable solar heat gain and heat losses, energy consumption and improve occupant comfort. Buildings with excessive glazing are difficult to heat and cool, requiring sophisticated mechanical systems to offset poor performance by the building envelope.
Code mandated higher insulation values & better materials; moisture and heat control of the envelope through better design. Higher efficiency requirements for mechanical systems; (fans & ducts, pumps & pipes, and wires & motors), lighting, controls, and other components of the building and it’s envelope. Energy modeling should be performed of larger significant buildings to optimize operations in the design phase. Commissioning of the building is integral to ensuring compliance throughout the project to it’s final phases at substantial completion and occupancy.
Renewable energy technologies including solar power and wind generation have been gaining rapid adoption elsewhere in the world, while in Alberta (8) carbon based fuels currently provide over 80% of electrical power generation. This has not been for a lack of wind and solar resources in Alberta but to be attributed to the large capital investments in fossil fuel resource extraction. Other renewable technologies such as bio-mass, hydro, and geothermal may also be employed and should be investigated as alternatives to existing thermo-electric power plants.
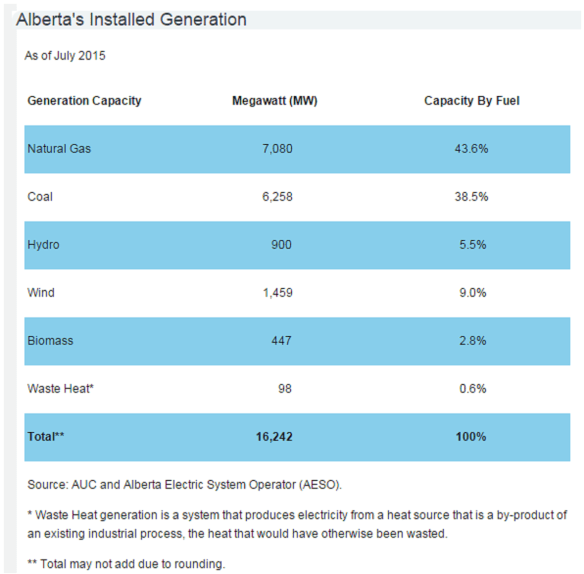
Table #1: Installed Electrical Generating Capacity by Fuel Source in Alberta (8)
Currently, Alberta has the third highest installed wind power capacity in Canada behind Ontario and Quebec. Wind energy not only represents a means to green the power production, it also will contribute jobs and income to the economy. As one source of electricity and revenues is removed another source will fill the void.
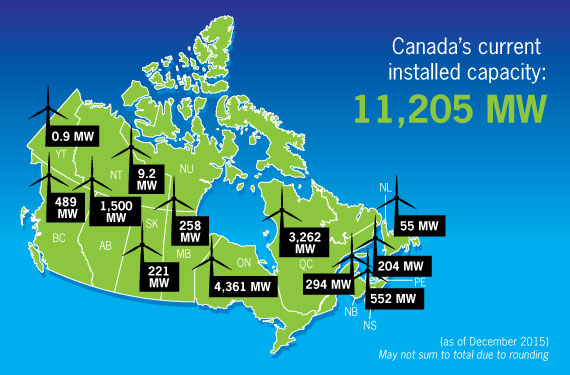
Map #2: Installed Wind Power Capacity by Province in Canada (9)
While significant inroads have been made in Alberta for wind power which is already established as a major power source for the future, there is unrealized potential for the installation of solar power production. It has been noted that a photo-voltaic installation in Calgary is 52% more efficient than one installed in Berlin, Germany. Meanwhile, Germany has 18,000 times more solar power generation capacity than installed in Alberta (10).

Map #4: Solar Resource Comparison for Alberta & Germany (10)
Alberta has significant solar resources, even during the winter when daylight hours are shorter. Lower temperatures improve PV efficiency, and properly tilted south facing panels optimize light capture, while the flat terrain of the prairies provide unobstructed maximum daylight. Light reflection by snow on the ground would further enhance light intensity during the colder months. Thus solar represents a relatively untapped potential source of significant electrical power for Alberta and an unrealized economic opportunity for consumers and industry.

Map #5: Solar Resource Map for Canada With Hotspots (11)
Renewable energy produces electricity from natural resources without generating carbon and particulate emissions. Another method of controlling emissions is to reduce the amount of energy consumed by being more efficient with the energy we already produce. We can achieve this by using higher efficiency equipment, changing consumer patterns of use to non-peak periods, use of Smart Meter’s to monitor consumer usage and to alert homeowners when there is a problem with high consumption which could result in higher bills than normal if the problem remained unreported.
There are other advancements in the electrical grid system which are on the horizon which will enable a utility maximize resources by such means as energy storage, micro-grids, demand response to name a few. Also, property owners and businesses could be able to grid-tie private solar panel (PV) and storage systems to supplement the utilities electrical system with additional power during the day.
In order to meet the goal of atmospheric emissions neutrality as agreed to at the 2015 Paris Climate Conference Alberta is posed with making decisions on how electricity is to be produced in the future. Eliminating coal power plants and replacing them with Renewable Energy power sources such as solar and wind power are proven methods to reducing GHG and particulate emissions as these power sources do not involve combustion and discharge of waste gases formed during the combustion process. Coal combustion is well documented as a major contributor of GHG’s to the atmosphere.
To make the transition will require capital for financing to build new infrastructure. Funding of these projects should be raised proportionally charged to users with increased rates. These rate increases will provide further incentives to reducing energy consumption and thus air emissions. Jobs will shift and employment will be created in new forms as the old is phased out and replaced with new technology. These new systems will have to be designed, built and maintained while the workforce will require training in new methods. There will be many new opportunities for growth and advancement resulting from the implementation of these changes to meet Canada’s International commitments.
References:

CHICAGO, Aug. 4, 2015 /PRNewswire/ — According to a new study … energy efficiency is recognized among U.S. higher education institutions as key to fulfilling their schools’ core mission, with almost 9 out of 10 respondents expecting to increase or maintain energy efficiency investments next year.
Photo: Lillis Complex, University of Oregon
Sourced through Scoop.it from: www.prnewswire.com
>” […] Eighty-eight percent of respondents also agree that energy efficiency is the most cost effective way to meet their energy needs while at the same time reducing greenhouse gas emissions and cutting costs.
The biggest factor driving schools’ energy efficiency efforts is cost savings, according to the survey conducted with higher education facility leaders, with environmental benefits and industry standards rounding out the top three reasons for becoming more energy efficient. However, obstacles exist to achieving these objectives. While 92 percent of respondents stated that their school had a culture that encourages energy efficiency practices, organizational barriers are challenging their ability to achieve efficiency goals. Fifty-nine percent view this as the biggest obstacle, with insufficient funding and lack of a clear definition of success also ranking highly.
Another factor impacting institutions is aging infrastructure, with 59 percent indicating that the average age of their buildings exceeds 15 years, and only one in five reporting that the average age of their building is below 10 years. As facility leaders look to upgrade existing buildings, compatibility with new technology ranks as most important when considering making an investment. Compatibility with legacy systems outranked quality of the product and technology advancements of the solution.
“A majority of the higher education buildings that stand today are expected to be in operation for the next few decades,” said Tara Canfield, Segment Director, Education and Commercial Office Buildings at Schneider Electric. “Tremendous opportunities exist to improve energy efficiency and reduce waste in these existing buildings. In particular, by integrating building systems, facility managers can view energy use from a single interface, identify long-term opportunities for savings and continuously optimize their facility to yield the highest levels of efficiency over time. This integration also enables organizations to better use data from the Internet of Things, turning building insights into meaningful action that will improve operations.” […]
This survey was conducted by Redshift Research in June 2015 among 150 U.S. facilities leaders in higher educational establishments. Respondents have responsibility related to purchasing energy solutions, and their biggest responsibilities included facility management and operations management. Results of any sample are subject to sampling variation. […]”<
See on Scoop.it – Green & Sustainable News
