About duanetilden

Engineer, Entrepreneur, Blogger, Farmer, Traveler and Nature Lover. I love music, quotes and blog about Green Building & Energy.

The Mind of a Market – Part 1

Author: Duane M. Tilden, P.Eng.                      Date: July 2, 2018

The arrow of time points forward; past events are irreversible

Foreword:

This article, has grown and is expanding as I write. Being my own editor I have to make decisions, so that in order to expedite publishing I am breaking the material down into parts. The idea behind this article is to explore what makes the cryptocurrency market move and the psychology behind the market, a collection of minds or “hive-mind“. We will use references from the stock market and investing community, social sciences, finance, engineering and other realms of thought and application.

I would like to postulate that collectively CC markets are populated by a type of person who has a basic understanding of the fundamentals of Bitcoin, blockchain and smart contracts, online interaction and the use of app’s, purchasing and trading, banking, stock markets, economics and other needed basics to make the ecosystem have value and meaning to the user.

Or perhaps, the user is in the process of learning these fundamentals, as such having desire and ability to learn new concepts and be able to employ them digitally is necessary for success. There are learning curves to be surmounted; patience, persistence and diligence are required. In any event I invite seasoned pro, novice or the curious to follow my explorations into the world of crypto.

Image result for whale

Photo #1: National Geographic – Migrating Whales

What is the Cryptocurrency Market?

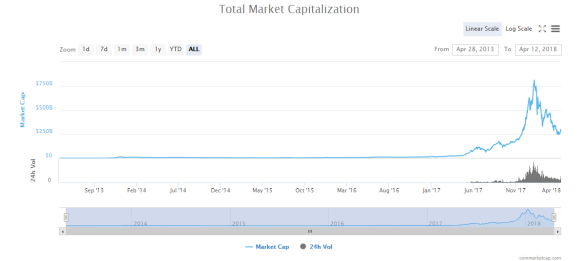
The cryptocurrency market is dominated by a few major assets, most notably Bitcoin which has a current dominance factor of 42.6%. Reviewing listed CC assets listed on the website coinmarketcap.com we find the use of charts and graphs useful in understanding how values and prices fluctuate over time in these markets. I have used these charts in previous articles, listed below is the current Total Market Cap of $257 Bn, which has recently increased by $21 Bn since Friday, June 29th.

Total Crypto Market Cap Jun 24 to Jul 1 2018 #1

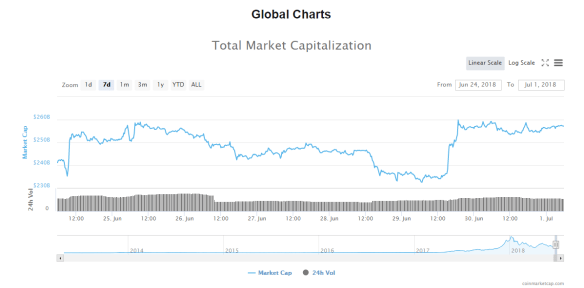
Figure 1: CryptoCurrency Total Market Cap Chart – June 24 to July 1, 2018

For the sake of simplicity, my analyses is generalized in nature. Individual traded assets have their own utility and value based on a multiplicity of factors, some of which may be intangible. When deciding which assets to choose for holding and trading there are many of those factors which become important when considering risking investment over time. We will delve into this issue in another post, all part of the due diligence process.

Over the past decade, blockchain technology has captured the imagination of technologists around the world, and in the past year Initial Coin Offerings (ICOs) of cryptocurrency tokens have exploded in popularity. In just the first four months of 2018, ICOs raised $6.3 billion USD in funding, 18% more than in all of 2017. (1)

As we can see from the excerpt taken from the CPA Ontario website ICO’s raised $6.3 Bn in funding for the first quarter of 2018. For argument’s sake we can extrapolate a value of $30 Bn for the year, or even more to $50 Bn if we assume more issues later in the year. However, considering the total trading values in active markets we can by inspection see that the ICO market is small compared to values traded on exchanges. Total Market Cap can increase by over $20 Bn or more in a day (2), and daily volumes also can vary in the same range of about $10 to $20 Bn over 24 hour periods.

As a final note, not all transactions in cryptocurrency need to be done through an exchange, and private transactions are not included in TMC analysis, although it is fair to assume that trade values of these transactions will be made close to current market prices. When trading on exchanges one must always be aware of the market depth compared to order size, which can cause significant run up in price when a large transaction is made on the market. One reason why experienced traders generally make smaller incremental buys or sales to limit market distortion and costs as well as profit from large trade orders which run up the market temporarily.

Modeling Generalizations

For the sake of most of my market reviews there are certain generalizations which I make, first is I exclude ICO’s as a minor influence on the market as a whole. Those who intend to issue ICO’s would be wise to incorporate market analysis and timing as part of their marketing strategy. Starting an ICO in a soft market will be more difficult when money is tight for investors, as an example.

The second generalization I make is to limit reviews generally to the top 25 listed CC’s by market capitalization. From past analysis I have found that over 80% of capital is contained in the top 25 while the remaining 1500+ listed account for the remaining 20% Total Market Cap. Movements of these coins may be important to the individual trader, however as factors that may move the whole market their sphere of influence is generally limited.

Thus, as we can see, the above reductions will simplify future modeling of cryptocurrency markets by eliminating ICO’s and examining global movements of the top 25 listed cryptocurrencies, of which Bitcoin currently dominates with a MC of $108 Bn USD, followed by Tether, Ethereum, EOS, Bitcoin Cash, Litecoin, etc.

Who are the Players in the CryptoCurrency Markets?

First there are the digital assets or cryptocurrencies, which we already discussed in general and of which there are many. However, we have reduced this population down to a usable quantity for analytical and discussion purposes by reducing the market to the top 25 and ignoring the effects of ICO’s on the market. Next to be discussed is the user base, which is a generalization for investors, holders, developers, traders, speculators and the consumer marketplaces. Some of these markets are more developed than others as more people learn the benefits of cryptocurrency, the blockchain and distributed ledger technology.

As both sides of the markets have grown we will examine the effect of exchanges and how this third component enables the other two components to interact much like how a third leg is necessary to the utility and stability of a stool. These virtual cryptocurrency exchanges have many similarities to the stock market as both represent an asset the basis of which are distinct and separable, frequently representing commodities or utility previously considered intangible.

Demographics of the User

Is it possible to identify the “average” or “normal” user, and thus be able to establish some trends or behaviours that can be predicted? Let us explore this concept further.

One Bloomberg News article found online mentions a survey which found 5% of 5700 adults surveyed owned Bitcoin.

Nearly 60 percent of Americans have heard or read about the world’s largest cryptocurrency, according to a joint SurveyMonkey and Global Blockchain Business Council poll of more than 5,700 adults conducted in January. But only 5 percent of people actually own the digital coin.

Those few Bitcoin investors are of a fairly consistent demographic. An overwhelming 71 percent of them are male. The majority — 58 percent — are young, between the ages of 18 and 34 years old. And unlike the broader U.S. population, nearly half of them are minorities. (3)

Another survey is more thorough providing demographics on users interviewed in their surveys. It also provides interesting feedback as to the nature of existing resistance to adoption as seen below in Figure 2. Something which should be paid particular interest.

Finder

Figure 2. Table of Reasons – Resistance to CryptoCurrency Adoption

Other interesting demographic information can be examined such as age groups, gender, income level and ethnicity of those surveyed may provide useful information. For example who are those most likely to invest in Bitcoin or other Cryptocurrencies? This survey compares Millennials, Gen X and Babyboomer generations.

Millennials and Generation X

A similarity between the results of the Finder survey and the survey by LENDEDU is that Millennials are the largest group invested in cryptocurrency followed by Generation X.

The survey by Finder found that among those who purchased cryptocurrency there are:

  • 17.21 percent of Millennials surveyed,

  • 8.75 percent of Generation X surveyed.

Finder

Figure 3. Table of Crypto Investors by Age Group (4)


Summary Comments – Part 1

In order to make sense of our examination of the cryptocurrency market we have used scientific methods of reduction to group together data in meaningful ways and thereby reducing workloads. The generalizations, rules or assumptions are that the market is fairly well represented by the movements of the top 25 listed cryptocurrencies, and that ICO’s are a separate market which has little effect on the main market.

The current model is a spreadsheet analysis of price and total market capitalization of the top 25 cryptocurrencies as listed on Coinmarketcap.com for a particular time period. Cycles in capitalization may be uncovered through data analysis. Also opportunities in markets and penetration. Current surveys indicate populations which require more attention and information for wider adoption which are useful for marketing campaigns.


Part 2 (To be Continued)

  • Trading Exchanges and Price Movements
  • Whales and Institutions
  • Trading Levels, Trust and the Nash Equilibrium
  • Time Frames, Cycles and Risk
  • Geographical and Geopolitical Factors


References:

  1. navigating-the-brave-new-world-of-cryptocurrency-and-icos
  2. weekly-market-cap-surges-50-billion-cryptocurrency-prices-continue-to-rise/
  3. a-look-at-who-owns-bitcoin-young-men-and-why-lack-of-trust
  4. how-many-americans-really-own-crypto-skewed-results-of-polls-and-surveys


Advertisement

Market Sentiment Analysis of Candlestick Charts

Author: Duane M. Tilden, P.Eng.                       Date: June 23, 2018

To become a successful trader in markets, such as cryptocurrency trading, one has to develop strategies which will give them the greatest probability of success, or for most, a profit.

How much risk and reward is up to every trader, as well as the selection of digital assets held and quantity. There are short, medium and long term goals and various methods of achieving each one of these objectives.

One tool that is very useful for developing short term trading strategies which can return a profit to the trader, is understanding Candlestick charts.

Figure 1: Anatomy of a Candlestick (1)

Anatomy of a candlestick

For reading and developing trading strategies, understanding the mechanics of a candlestick chart can lead to opportunities in trading assets to maximize ROI (return on investment), or to determine when to buy and sell assets.

How to Read a Single Candlestick (2)

Each candlestick represents one day’s worth of price data about a stock through four pieces of information: the opening price, the closing price, the high price, and the low price. The color of the central rectangle (called the real body) tells investors whether the opening price or the closing price was higher. A black or filled candlestick means the closing price for the period was less than the opening price; hence, it is bearish and indicates selling pressure. Meanwhile, a white or hollow candlestick means that the closing price was greater than the opening price. This is bullish and shows buying pressure. The lines at both ends of a candlestick are called shadows, and they show the entire range of price action for the day, from low to high. The upper shadow shows the stock’s highest price for the day and the lower shadow shows the lowest price for the day.

Bearish and Bullish Candlesticks

A candlestick represents the price activity of an asset during a specified timeframe through the use of four main components: the open, close, high and low.

The “open” of a candlestick represents the price of an asset when the trading period begins whereas the “close” represents the price when the period has concluded. The “high” and the “low” represent the highest and lowest prices achieved during the same trading session.

There is much more to reading and understanding candlestick charts than is covered here. This brief has informational links to where more information on patterns and indicators, and advice on how to use these patterns to make decisions in trading.

Bottom Line (2):

Investors should use candlestick charts like any other technical analysis tool (i.e., to study the psychology of market participants in the context of stock trading). They provide an extra layer of analysis on top of the fundamental analysis that forms the basis for trading decisions. We looked at five of the more popular candlestick chart patterns that signal buying opportunities. They can help identify a change in trader sentiment where buyer pressure overcomes seller pressure. Such a downtrend reversal can be accompanied by a potential for long gains. That said, the patterns themselves do not guarantee that the trend will reverse. Investors should always confirm reversal by the subsequent price action before initiating a trade. (Read more in Candlestick Charting: Perfecting The Art)

References:

  1. crypto-trading-101-beginners-guide-candlesticks/
  2. using-bullish-candlestick-patterns-buy-stocks

Microgrids and the Blockchain – Transforming the Energy Supply

Author: Duane M. Tilden, P.Eng.           Date: June 10, 2018

In the transition from the centralized utility is the development of the Micro-grid.  The Micro-grid offers many benefits to society, including; (a) use of renewable energy sources that reduce or eliminate the production of GHG’s, (b) increases in energy efficiency of energy transmission due to shortening of transmission distances and infrastructure, (c) improved municipal resilience against disaster and power reductions, and finally, (d) promotion of economic activity that improves universal standard of living. (1)

The Brooklyn Microgrid Experiment

A Network of Energy Cells (2)

In order to be successful, blockchain platforms and microgrids require a regulatory framework. In New York State, such a framework is provided by “Reforming the Energy Vision” (REV). The platform’s objectives are to minimize the vulnerability of the power supply system that became visible during Hurricane Sandy, to use more sources of renewable energy, and to reduce costs.

The Brooklyn Microgrid is a good test case for these objectives. “A microgrid is a nucleus that sets the stage for an energy future consisting of networks of energy cells,” says Stefan Jessenberger from Siemens’ Energy Management Division. “Blockchain also supports this process, because it makes it much easier to conduct energy trading within cells.”

Siemens Digital Grid, next47, and LO3 Energy all believe in the potential of blockchain-based microgrids, because this technology can be used wherever there are decentralized energy sources. “Our experiences with the Brooklyn Microgrid will certainly flow into future projects,” says Kessler.

 
Image #1: A Canal in Brooklyn, New York (5)

The Future is Now

But something else is happening to the grid as energy generation changes – the rise of microgrids. These smaller grid systems are linked to localised power sources, often referred to as “distributed generation” sources. For example, a handful of buildings in a city with their own solar panels might be connected to nearby residences.

In fact, that is exactly the model that LO3 Energy has experimented with in its Brooklyn Microgrid project. Customers signed up to it can choose to power their homes via a range of local renewable energy sources. People with their own solar panels can sell surplus electricity to their neighbours, for example. It’s a peer-to-peer network for electricity.

To ensure that accurate records of these transactions are kept, LO3 has opted to use blockchain distributed ledger technology. This means the microgrid’s accounting is decentralised and shared by everyone on the network.

“It’s virtually unhackable,” says founder and chief executive Lawrence Orsini, explaining that tampering with these records is almost impossible because of the fact that everyone has their own, regularly updated copy of the ledger.

LO3 is now rapidly expanding with a series of other projects around the world. One is based in South Australia, where Orsini explains there is already a lot of distributed generation going on – and plenty of grid stability issues. Users can now experiment with LO3 to get access to electricity from solar-fuelled batteries nearby when needed. (3)

Physical and Virtual Microgrids

Challenging the traditional electrical supply model are microgrids. The “microgrid” term normally refers to a localised grid that can disconnect from the main grid and operate autonomously. It uses local sources of energy to serve local users, integrating the supply of energy from various producers, including local power generators and providers of renewable energy such as solar power. Consumers with their own energy production capabilities (wind turbines or solar energy systems) can sell their surplus energy production back to peers in the microgrid, on a pay-per-use basis (becoming ‘prosumers’).

While physical microgrids are still rare, we do observe the development of virtual microgrids using peer-to-peer energy trading. Blockchain is just one element in the transformation of electricity supply, providing Distributed Ledger Technology (DLT) to members of a peer-to-peer energy network, or microgrid. It offers [or ‘provides’] a reliable, lower-cost digital platform for making, validating, recording and settling energy transactions in real time across a localised and decentralised energy system.

With increasing demand for more flexible energy supplies we expect a continued increase in the number of virtual microgrids and a gradual movement towards true, physical microgrids along 4 stages […] (4)

“This project…, is the first version of a new kind of energy market, operated by consumers, which will change the way we generate and consume electricity.”
New Scientist (5)

References:  

  1. microgrid-as-a-service-maas-and-the-blockchain/
  2. smart-grids-and-energy-storage-microgrid-in-brooklyn
  3. http://www.wired.co.uk/article/microgrids-wired-energy
  4. energy-and-resources/articles/will-microgrids-transform-the-marke.html
  5. http://brooklynmicrogrid.com/

Game Theory and Markets: Schelling Points and The Nash Equilibrium

Author: Duane M. Tilden, P.Eng.        Date: June 10, 2018

Prologue:  It’s been a few weeks since my last blog post as I have been quite involved in other matters. As part of my work involves research and learning I would like to organize some of my discoveries and thoughts and relate them further by curation and publication on my blog.

Some things that I have been aware of it seems to me, intuitively, are rules which have been previously codified by others. Two now under examination are named after their discoverer’s respectively; Schelling Points and The Nash Equilibrium.  These ideas have profound implications in various forms of trade, microeconomics, macroeconomics, and cryptoeconomics.

Schelling or “Focal” Points

In the study of crowds or markets as an example we will find that there will be a tendency of people to gravitate towards the familiar in the absence of information. Such information is useful in the study of how people tend to behave. This information can also used to make optimal choices between two or more people in games of strategy whether between strangers where the others’ choice is unknown, or between friends or groups who may be more predictable in behaviour.

Image result for grand central station new yorkImage 1:  Grand Central Terminal turned 100 years old in 2013. Photo: Buck Ennis

In my own study of markets and their behaviour it is noticeable that one can postulate certain cycles based on common patterns where conflicts for disposable income can affect the movement of capital in and out of the market. I find that this is very similar to what has been found by Thomas Schelling and is also known as “focal points”.

Image result for thomas schellingImage 2: Thomas Schelling received his Ph.D. from Harvard in 1946 and joined the Harvard faculty in 1958. Photo by Martha Stewart

Thomas Schelling, the Nobel-winning game theorist … found in an informal survey that many of his students tended toward the same answer when posed this question about New York City: they would wait under the clock in Grand Central Station at 12 noon, hoping their partners had the same idea.

He introduced this concept in his 1960 book The Strategy of Conflict as a “focal point” – a solution to a coordination problem that somehow stands out as the natural answer even if the participants don’t have a chance to arrange it beforehand. Schelling argued that people’s apparent ability to coordinate without communicating was key to understanding how real-life strategic games are solved.

As game theory has developed in the decades since, Schelling’s ideas about focal points have been rarely studied, partly because the existence of focal points was perceived more as a mysterious, sociological phenomenon rather than an economic one amenable to analysis.

Schelling argued that people’s apparent ability to coordinate without communicating was key to understanding how real-life strategic games are solved.

Schelling himself said trying to determine the focal point of a game analytically is like trying to use a computer to understand whether a joke will be funny – it depends on cultural context and the relationship of the people trying to coordinate. Even the classic Schelling focal point of Grand Central might not apply if you asked different groups of New Yorkers who lived in different parts of the city or never took the trains that pass through the station.

The Nash Equilibrium

The Nash Equilibrium is a basic solution set which can be identified in every day life through some observation. One of the better examples it the driver matrix on a two-way street, where the optimal solution is for both drivers to drive on the left hand or right hand side of the road. If not, then a collision will likely result as both cars will be moving in opposing directions head-on.

Generally speaking one can view this equilibrium as an expectation that in various scenario’s where a choice is required, the person will behave in their own best interests. Understanding this concept is essential to how incentives work in an economy and how such incentives can be used to modify a person’s behavior, whether in a game, company, group, or a market.

Nash Equilibrium is a term used in game theory to describe an equilibrium where each player’s strategy is optimal given the strategies of all other players. A Nash Equilibrium exists when there is no unilateral profitable deviation from any of the players involved. In other words, no player in the game would take a different action as long as every other player remains the same. Nash Equilibria are self-enforcing; when players are at a Nash Equilibrium they have no desire to move because they will be worse off.


Cryptocurrency Weekly Market Cap Analysis and Forecast: Issue #1

Author: Duane M. Tilden, P.Eng.

Report Period: April 19th to 23rd, 2018

Disclaimer: The author is an active trader in cryptocurrencies and may have variable holdings in some or all digital assets reviewed. Trading and investing in cryptocurrency markets is considered a high risk venture and requires analysis, due diligence and patience. No guarantees on outcomes are offered or implied, market performance may change due to unforeseen events which may alter market participation. The analysis and subsequent forecast are “best guesses” or opinions based on information reviewed and methodology of examination and therefore may be subject to change.

Foreword

At this time I am planning to issue a weekly report and analysis. The reader is encouraged to read the analysis and familiarize themselves with terminology, cryptocurrencies and markets. Links, where deemed necessary will be included for reference and clarity. 

Purpose

The purpose of this ongoing blog is to develop and examine data in a scientific and methodical manner using a variety of tools to understand the movement of capital and price fluctuations in the cryptocurrency market. The cryptocurrency market is well known to be subject to volatility and can move quickly. To maximize profits a trader needs to have information into market movements which can be verified by various means of inquiry.

We will discuss these changes and explore the underlying causes. Forecasts made are our hypothesis or “best guess” and will be the basis of a Trading Plan.  Changes in holdings or planned capital investments may be made to adjust holdings to the forecast.  After the week we can review the results to determine how accurate our model and forecasts have been, and any required refinements.

Empowered with these tools it is hoped that those desiring to trade in these markets will be able to better evaluate portfolios and individual holdings to make buy, sell and/or hold decisions.

Weekly Analysis of Market

A. Total Market Cap

Using the tools we have developed to date let us continue with analyzing the cryptocurrency trading market using data from the past week. We seek to establish trends and using this information to forecast probable outcomes in the week ahead. To start lets take a look at the Total Market Cap (TMC) for the past week to spot the trends and chart data for further analysis. Total Crypto Market Cap April 16 to 23 2018

Total Crypto Market Cap April 16 to 23 2018 #2

Figure 1: Cryptocurrency TMC Weekly Graph of April 16 to 23rd, 2018

We can see that the overall trend for the week has been steadily increasing with a short dip on April 21st. TMC increased by $78 Billion from $322 to $400 bn for a weekly increase of 24.2%. Daily volume has increased by $7bn from $15.5 to $22.5 bn for a 45% gain over the week.Total Crypto Market Cap Mar 23 to Apr 23 2018 #1.png

Figure 2: Cryptocurrency TMC 30 Day Graph – March 23 to April 23rd, 2018

This is continuing the reported upward trend from last that started on Monday April 9th where TMC was above $250 bn moving to April 12th where TMC started at $275 bn and rose by $25 bn in under one hour to $300 Billion. Daily volume peaked on April 13th to over $27 Billion traded in 24 hours. The two week change in TMC is $150 bn from $250 to $400 bn, for a 60% gain with an average rate of increase $10.7 bn/day or 7.13%.

B. Analysis of the Top 25 Cryptocurrencies by Market Cap and Price

TMC Top 25 Cryptocurrencies April 19 to 23 2018

Figure 3: TMC and Dominance of Top 25 Cryptocurrencies; April 19 to 23rd, 2018

A spreadsheet has been created to examine a variety of components of market capitalization, pricing and dominance and their variance over time. Where there are significant changes from the norm we can look for reasons to understand individual price changes and capital movement.

C. Variation in Dominance as a Predictive Indicator

The use of a dominance factor gives us an indication of the overall contribution to the TMC of an individual cryptocurrency coin or token. When this factor changes significantly over a measured period of time we may observe movements in price or MC which stand out from the overall market average.

From the period examined we have the following predictions for the upcoming week based on variance on dominance. Dominance indicates a current established trend in buying or selling. Where dominance is high and positive then for a fixed supply MC and Price will rise, and when high and negative the converse is true, that the cryptocurrency MC and Price are in a decline in value.

Caution is the word; not all declines in dominance are bad nor increases necessarily good. Sometimes when a market has moved too far in one direction a market correction may be in order and short term changes in dominance may indicate a correction. Increases in dominance should be examined for underlying cause for the cryptocurrency to gain popularity in the market.

Be aware, there are pump and dump schemes which can run up values in MC and Price for a short term while the architects of these manipulation activities profit. Generally speaking the organizers target obscure coins and tokens held on certain exchanges. Due to size and wide distribution the top 25 cryptocurrencies are considered safer from influence and price manipulation, although not immune.

In future articles I plan on performing more detailed examination of results and expand predictions or forecasts to include possible future outcomes as well as explore underlying causes to individual price movements.

Recommendations:

Top pick for the week is Bitcoin Cash.

Top 5: Buy or Hold

  1. Bitcoin Cash variance in dominance increased by 28.30 %
  2. IOTA variance in dominance increased by 7.94 %
  3. Monero variance in dominance increased by 5.51 %
  4. Ripple variance in dominance increased by 5.08 %
  5. Bitcoin Gold variance in dominance increased by 4.83 %

Bottom 5: Sell or Hold

  1.  Qtum variance in dominance decreased by -13.24 %
  2.  Tether variance in dominance decreased by -11.27 %
  3.  OmiseGo variance in dominance decreased by -10.96 %
  4.  Stellar variance in dominance decreased by -8.90 %
  5.  NEO variance in dominance decreased by -8.14 %


Oilsands and Fossil Fuels Receive Major Blow Due to Paris Agreement

LONDON — Europe’s largest bank HSBC said on Friday it would mostly stop funding new coal power plants, oilsands and arctic drilling, becoming the latest in a long line of investors to shun the fossil fuels.

Other large banks such as ING and BNP Paribas have made similar pledges in recent months as investors have mounted pressure to make sure bank’s actions align with the Paris Agreement, a global pact to limit greenhouse gas emissions and curb rising temperatures.

“We recognize the need to reduce emissions rapidly to achieve the target set in the 2015 Paris Agreement… and our responsibility to support the communities in which we operate,” Daniel Klier, group head of strategy and global head of sustainable finance, said in a statement.

via Europe’s biggest bank HSBC says it will no longer finance oilsands projects — Financial Post

Banning the Internal Combustion Engine: Is this the end of Fossil Fuels?

As a general rule I find that most North Americans are unaware that there is a growing movement of countries that are banning new sales of vehicles powered by gasoline or diesel and may also include other fuels such as propane, compressed and LNG (liquid natural gas).

The local news is rife with plans to grow our exploitation of natural resources and build more pipelines for anticipated expansion to new markets such as China. The federal government is in the process of colluding with the petroleum industry to force the construction of a dil-bit pipeline in a densely populated region of Greater Vancouver.  Meanwhile our future markets are vanishing as other governments are phasing out fossil fuels and their engines.

Image #1: A rendering of the Silent Utility Rover Universal Superstructure (SURUS) platform with truck chassis. 

SURUS was designed to form a foundation for a family of commercial vehicle solutions that leverages a single propulsion system integrated into a common chassis. (1)

Fuel cell technology is a key piece of GM’s zero-emission strategy.

General Motors’ Silent Utility Rover Universal Superstructure (SURUS) is an electric vehicle platform with autonomous capabilities powered by a flexible fuel cell. GM displayed it at the fall meeting of the Association of the United States Army, as the commercially designed platform could be adapted for military use.

SURUS leverages GM’s newest Hydrotec fuel cell system, autonomous capability and truck chassis components to deliver high-performance, zero-emission propulsion to minimize logistical burdens and reduce human exposure to harm. Benefits include quiet and odor-free operation, off-road mobility, field configuration, instantaneous high torque, exportable power generation, water generation and quick refueling times. (1)


Table 1. List of Countries Banning the ICE & Timeline (2)
Wikipedia Table of Countries Banning the Internal Combustion Engine.png

At an automotive conference in Tianjin, China revealed it was developing plans towards banning fossil fuel-based cars. Though China has not set a 2040 goal like the U.K. and France, it said it was working with other regulators on a time-specific ban.

“The ministry has also started relevant research and will make such a timeline with relevant departments. Those measures will certainly bring profound changes for our car industry’s development,” Xin Guobin, the vice minister of industry and information technology, said.

Both India and Norway have also said they have electric car targets set for the next few decades. India, home to heavily polluted cities, said by 2030 it plans to have vehicles solely powered by electricity. (3)

Final Remarks:

I explain this worldwide movement to the electric vehicle and the impact this will have oil markets, however, most of whom I discuss this issue with are unaware of these vital facts. In addition we are seeing growing alternate forms of power sources for our electrical grid, such as solar, wind, tidal, hydro-electric, geothermal and others.

If you ran a business that called for a major investments in capital for infrastructure, would you make it knowing that your market is non-existent? Maybe it’s time for Canadians and Americans to wake up and smell the coffee.

References:

  1. fuel-cell-electric-truck-platform
  2. List_of_countries_banning_fossil_fuel_vehicles
  3. how-internal-combustion-engine-bans-could-catalyze-big-oil-concerns

Weekly Market Cap Surges $50 Billion; Cryptocurrency Prices Continue to Rise

Previously, I reported on Cryptocurrency Market Capitalization and its relevance to understanding movements in the prices of cryptocurrencies. Let’s take a look at the markets one week after the reported $25bn of capital was put into the crypto markets. Refer to Figures 1 and 2 below, where in Fig. 2 we see that the TMC moved from $275 bn to $300 bn in under one hour.

Total Crypto Market Cap April 12 to 19 2018

Figure 1. Total Market Capitalization April 12 to 19th, 2018


Total Crypto Market Cap April 5 to 12 2018

Figure 2. TMC April 5 to 12th, 2018 (1)

Inspection of Figure 1. indicates that the TMC demonstrates a weekly upward trend. After the initial spike of $25 bn reported last Thursday, another $25 bn was added to the TMC Friday. For most of the week it hovered at the $325 bn level until Wednesday April 18th. Since then another $25 bn has been added over 24 hours to a new level of $350 billion. This is a total increase in the TMC of the Cryptocurrency market in one week of $75 billiion, or 27.2 %, from $275 to $350 billion.

TMC Top 25 Cryptocurrencies April 19 2018
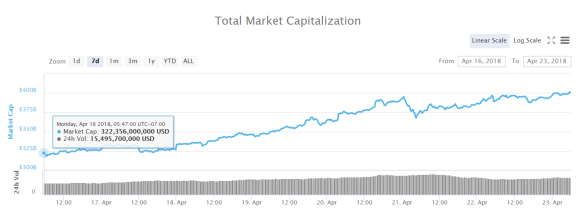
Figure 3. TMC of Top 25 Cryptocurrencies, April 12th to 19th 

Top 25 Cryptocurrencies

Of the listed 1574 cryptocurrencies traded on over 10,000 markets as reported by the website CoinMarketCap we see that Bitcoin represents over 39% of the TMC, and the top 25 altogether account for over 87% of capital in the market.

Of the 25 listed coins/tokens inspected we see that 22 advanced and only 3 retracted on the week, for 88% of the listed cryptocurrencies in the green. Most of these advanced by 25 to 35% over the week, with Stellar advancing the most at 59%. This is an example of a competitive marketplace where various suppliers are in competition for market share.

Note that the TMC increased from $275 to $350 Billion USD or 27%, and by inspection we can see that the average price of the cryptocurrencies listed in the top 25 increased by a rate between 25 to 35%. At present the TMC of $350 bn is 42% of the peak TMC of $829 bn  which occurred earlier this year on January 7, 2018. Since the peak the TMC has been generally trending down to current levels.

We can see from the forgoing that there is a strong correlation between TMC and the price movements of the various cryptocurrencies. This is the market dynamic of supply and demand in action; as the money supply increases in a market of fixed supply such as cryptocurrency, the prices of said commodities in that market must rise.

Is it possible that we have seen the bottom range of current TMC and moving forward we may experience more uptrends.

Happy Trading!

References:

  1. understanding-cryptocurrency-trading-markets-and-total-market-capitalization/


Understanding Cryptocurrency Trading Markets and Total Market Capitalization

Note: Soon to come is a separate blog for Digital Assets where I will continue to write, curate and publish these types of articles, reports and reviews relating to the Digital Asset Class, FinTech, Blockchain, Smart Contracts, CryptoCurrency and Markets. Duane M. Tilden, P.Eng; April 12, 2018.

Foreword:

Working on technical analysis of cryptocurrency, such as Bitcoin, we search for causes and effects to understand what makes markets move or prices to change. This is quite similar to how we may view the stock or commodity markets and a lot can be gained from techniques used by stock analysts and traders. Knowing how much of a commodity one can purchase for a given price is often vital to budgeting, whether it’s for a construction project, a dinner, or some other financial endeavour. If I cannot purchase enough of one product for a particular price then I must either raise more capital, or purchase an inferior product that may meet the specification or recipe, if one is available that can achieve the desired outcome.

Observing trends on charts and graphs is part of the toolbox where changes in pricing, volume or other parameters are graphed over time. We search for short, medium and long term trends. When something happens in a marketplace we assume there is a reason and look for relationships so that we can further understand market influences on pricing. Down to a basic level we seek “if this, then that”. This is the basis of supply demand economics.

Thursday, April 12th 2018 we saw that the price of Bitcoin went from trading at about $6800 to $7800 USD overnight, an increase of about 15%. An excellent opportunity to investigate what is the cause of this change in price and subsequent effects in the cryptocurrency market. How does this event distinguish itself from other price changes we often read or hear about regarding Bitcoin? If you wish to know more, read on.

Market Cap and Total Market Capitalization

Prior to the advent of cryptocurrency markets Market Capitalization is used in the financial world to define the size of a company by multiplying the current stock price by the number of outstanding shares to determine the size of a company. Currently the usage of Market Capitalization and Total Market Capitalization are applied also to the issues of Cryptocurrencies such as Bitcoin, Ethereum, Litecoin, Ripple, Tron, Lisk, Minex, Dash, EOS and a multitude more. Every month new coins and tokens are emerging with whitepapers, websites, and ICO offerings.

Simply put, the Total Market Capitalization (TMC) is the sum of all the cryptocurrencies Market Caps (MC) listed and traded on the polled markets. It is important to remember this basic concept regarding markets in that there are events in the world which may cause change in attitudes or availability of capital, and movements of capital in or out of the market are reflected in the Total Market Cap. As this value moves so does money in and out of the markets.

Total Crypto Market Cap 2013 to April 12 2018

Figure 1. Total Market Capitalization of Listed Cryptocurrencies, April 28 2013 to April 12 2018

Total Crypto Market Cap April 5 to 12 2018

Figure 2. Total Market Capitalization of Listed Cryptocurrencies, April 5 2018 to April 12 2018

Bitcoin Price on Coinbase 4122018

Figure 3. Bitcoin $1000 (15%) One Hour Price Increase on Coinbase on April 12th, 2018.

Examining the forgoing graph on Figure 1 we can see how most of the TMC has been raised in the last 12 months. The TMC peaked on Sunday, January 7th 2018 with a value of $813.87 billion, and has a current value (April 13th, 2018) of $301.79 billion. Note that when we examine Figure 2 and the weekly chart of TMC we see a decided jump in value from around $275 billion to the current $300 billion, indicating $25 billion was introduced into the cryptocurrency market in less than a day.

Dominance - Percentage of Total Crypto Market Cap April 2013 to 2018

Figure 4. Historical Dominance Chart – Percentage of TMC by Cryptocurrency 

In Figure 3, this influx of capital into the market was reflected in the rapid increase in the price of Bitcoin, which has the highest trade volume on all markets and is dominant in the cryptocurrency market as seen in Figure 4. Coinbase price for Bitcoin shot up from $6856 to $8011 in about one hour, marking a jump in value of $1155 or 16.8%.

Almost all other cryptocurrencies followed suit and prices increased across the board as the previously tight bear market flooded with new capital. Sell orders were triggered as the prices rose rapidly and traders had new capital to reinvest into the market, resulting in further increases in alt coin prices.

Markets and Events

So we have clear evidence that a surge or influx of capital has entered the market. Now the questions that remain in our analysis of this significant event or change in the market are threefold; 1. What happened?  2. Who is making the trades?  3. On what markets?

1. What Happened?

One potential cause for this change in TMC is the entrance of new money or players in the market. A study released on April 10th regarding the compliance of Bitcoin and cryptocurrencies meeting Islamic law relating to money and usury concluded by one Islamic scholar to be halal, or meeting strict Islamic requirements. For cryptocurrency holders this is important news as it opens markets to a significant sized population of potential users and investors.

JAKARTA, Indonesia. – April 10, 2018 – As fluctuations and volatility continue to rock the cryptocurrency world, Blossom Finance has commissioned and released a working paper exploring the Islamic permissibility of bitcoin, cryptocurrency, and blockchain. The paper concludes that Bitcoin fully meets the definition of Islamic money under certain conditions and is generally permissible under Shariah. Blossom’s research also includes analysis of various legal opinions (fatawah) issued by prominent Islamic scholars on the topic. The research and development of the working paper was led by Mufti Muhammad Abu Bakar – Blossom’s internal Shariah advisor and Shariah compliance officer.

2. Who is Trading and Why?

Let’s examine another report on this recent price spike to see if there is a correlation on what occurred on April 12th.

Bitcoin, the most dominant cryptocurrency in the global market, recorded a 15.94 percent increase in value, from $6,900 to $8,000. The price of the cryptocurrency rose by $1,100 within a 30-minute window, as massive buy volumes emerged. […]

To influence the price of bitcoin, which has a daily trading volume of above $9 billion, billions of dollars would have to be traded. More importantly, billions of dollars worth of new capital have to flow into the cryptocurrency market in order for the price of bitcoin to spike up, and bring the entire market with it.

The April 12 surge in the price of bitcoin was not caused by investors cashing out from alternative cryptocurrencies (altcoins) to bitcoin or reallocating their funds from other major cryptocurrencies to bitcoin, because the valuation of the cryptocurrency market increased by more than $20 billion.

A wave of new investors or potentially a few institutional investors likely allocated billions of dollars into the market in a short period of time, causing a short-term pump and leading the price of the cryptocurrency to surge.

It is virtually impossible to pinpoint a single factor to justify the price trend of any cryptocurrency, because a variety of factors can contribute to the momentum of a cryptocurrency.

https://www.ccn.com/bitcoin-price

As we see from this article on CCN they report on the price surge however dismiss the ability to determine the cause of this price movement as “virtually impossible”. While this may be the case when examining the price movement of individual coins, it is different when the whole market moves in unison. When this occurs we seek further explanation to determine whether this movement is a short term spike, or if the market has moved up to another level. For hodlers an increase in TMC to a higher level is good news, although it depends if investment is of a centralized holder or a widely dispersed or decentralized population.

There is a potential of overlooking causes in the market or performing a superficial analysis if we do not include the TMC in our study. One market analyst attributes to the surge in Bitcoin price to other factors such as short positions as follows;

Brian Kelly, CNBC contributor and head of BKCM, which runs a digital assets strategy for clients said: ”Once bitcoin broke higher, shorts were squeezed and forced to cover.”

“The ratio of short margin trades versus longs has been increasing recently,” said Nick Kirk, quantitative developer and data scientist at Cypher Capital, a cryptocurrency trading firm. “Buying volume ticked up today and a lot of these short trades got liquidated, helping fuel the rally.”

https://www.express.co.uk//-news-update-cryptocurrency-latest-surge

Others relate the price surge to relief of upcoming tax filing deadlines compounded by short positions;

Some market participants believe that Thursday’s sudden upward price move “could be an unwinding of that (tax-related) pressure,” and the spike had a compounding effect as it “forced traders who had bet against the cryptocurrency to buy back into the market,” reports CNBC.

why-did-bitcoin-jump-1k-april-12

These analysis overlooks the overall increase of $25 billion to the TMC or the rally in the rest of the market. If the connection between the price rises and increase in TMC is being caused by a new population of investors representing 1.6 billion people, then this is a likely indication of more to come in the future and we are seeing the first wave of new capital enter markets.

3. On What Markets are They Trading?

Where these trades are being made is a more difficult task requiring some deeper digging into available data. If we find that all of the capital is coming into the market on only a few or one exchange then that would be indicative of a centralized actor in the market, while if we see more evenly traded entry across a number of markets this may indicate a wider dispersed population. At this time we have no information if any abnormal trading occurred on any market on April 12th except for an overall increase in volume. Deeper analysis is beyond the scope of this report, and I will leave it as an exercise for the interested reader.

Exploring the historical data records on CoinMarketCap it is revealed that the 24 hour trading volume went from $4,641,890,000 on April 11th to $8,906,250,000 on April 12th. Clearly the increase in trading volume of $4.3 billion is not the TMC of $25 billion, and we look also at the price increase to get an indication of the increase in MC. From the same data chart we read that MC increased from $118,048,000,000 to $134,114,000,000 for a total of $16.1 billion which would be a dominance factor of 0.64 on the increase of $25 billion TMC. Currently the Bitcoin dominance factor is at about 0.40 and has been rising.

Final Remarks

The forgoing analysis is not an exact science and as we can see relationships are not always inelastic. For example the increase in the TMC of $25 billion cannot be accounted for by the increase in Bitcoin trading volume of $4.3 billion divided by the Dominance Factor of 0.4 which would predict an increase in Total Trading Volume of $10.75 billion. This would indicate that there is a multiplier effect on invested capital to TMC. Also, capital is constantly flowing in and out of the markets and may change hands many times in one day. All of these and others unexamined factors may affect the TMC.

Events in this world form links in a causal chain, and often to manage best our resources information on relationships between various factors are important to understand when forming investing strategies or making budget decisions. Analysts provide qualified opinions on trends, and predictive market analysis is an important and valuable tool in decision making. Understanding fundamental market economics is essential to understanding cryptocurrency markets.


Why Oil and Pipelines Are a Bad Deal For Canadians – Kinder Morgan/Oil Sands

Let’s get straight to the point. Canadians are getting ripped off. We pay the among the highest prices in the world for our own plentiful resources. Meanwhile we ship it to the US and abroad. This is in clear conflict with stewardship goals of our resources, environment and our collective future. What gives Mr. Trudeau?

Canada taxes its oil and gas companies at a fraction of the rate they are taxed abroad, including by countries ranked among the world’s most corrupt, according to an analysis of public data by the Guardian.

The low rate that oil companies pay in Canada represents billions of dollars in potential revenue lost, which an industry expert who looked at the data says is a worrying sign that the country may be “a kind of tax haven for our own companies.”

The countries where oil companies paid higher rates of taxes, royalties and fees per barrel in 2016 include Nigeria, Indonesia, Ivory Coast and the UK.

“I think it will come as a surprise to most Canadians, including a lot of politicians, that Canada is giving oil companies a cut-rate deal relative to other countries,” said Keith Stewart, an energy analyst with Greenpeace.

Companies like Chevron Canada paid almost three times as much to Nigeria and almost seven times as much to Indonesia as it did to Canadian, provincial and municipal governments.

Chevron used to run its Nigeria and Indonesia projects out of the U.S., but after allegations that they evaded billions in taxes, their operations were moved to Canada.

According to data collected by the Guardian, Suncor also paid six times more taxes to the UK, and Canadian Natural Resources Limited (CNRL) paid almost four times more to Ivory Coast. (1)

Image result for oilsands

Figure 1. Taken from: Alberta First Nation presents evidence against Teck’s exploratory drilling for oil sands mine (2)

CALGARY – British Columbia’s government wants to restrict shipments of oilsands crude in pipelines and on railways cars in the province through a series of proposed new rules that is set to create additional uncertainty for Kinder Morgan Canada’s $7.4-billion Trans Mountain pipeline expansion.

The proposed rules also open B.C. up to jurisdictional challenges and have already exacerbated a spat with Alberta Premier Rachel Notley, who called the proposals “both illegal and unconstitutional.”

B.C. Environment and Climate Change Strategy Minister George Heyman announced Tuesday rules to limit “the increase of diluted bitumen transportation until the behaviour of spilled bitumen can be better understood and there is certainty regarding the ability to adequately mitigate spills.”

To that end, B.C. will establish an independent scientific advisory panel to make recommendations on if and how heavy oils can be safely transported and, if spilled, cleaned up.

Tuesday’s announcement did not specifically mention Kinder Morgan’s Trans Mountain expansion, which will boost the shipments of oil from Alberta to Burnaby, B.C. from 300,000 barrels per day to 890,000 bpd, but the B.C. NDP had promised to block the pipeline’s construction during an election campaign last year.

In an interview with the Financial Post, Heyman said B.C.’s Environmental Management Act “gives us the right, in addition to our responsibility, to defend B.C.’s vulnerable coastline, our inland waterways, our economic and environmental interests and that’s what British Columbians expect us to do.” (3)

Justin Trudeau, Bill Nye

References:

  1. revealed-oil-giants-pay-billions-less-tax-in-canada-than-abroad
  2. athabasca-chipewyan-first-nation-present-evidence-against-tecks-drilling-oil-sands-mine 
  3. b-c-proposes-new-rules-to-restrict-oilsands-exports-in-fresh-setback-for-trans-mountain-pipeline