Amager Resource Center Copenhagen, Designed by Bjarke Ingels Group (BIG)

The waste-to-energy plant in Copenhagen was selected as a citation winner in the 62nd Annual Progressive Architecture Awards.

Source: www.architectmagazine.com

“BIG won the competition for the 1.02 million-square-foot Amager Resource Center with this widely touted scheme, which promises to turn a waste-to-energy plant into a popular attraction. By integrating a ski slope into the roof and a rock-climbing wall up one face, the architects build upon the project’s location: a part of Copenhagen on the island of Amager that has become a destination for extreme sports enthusiasts, thanks to its parks, beaches, dunes, and a lagoon for kayaking and windsurfing.  At 100 meters tall, the center will be one of the city’s tallest landmarks when completed—and a striking example of building-as-landscape. Indeed, the client has taken to calling it the Amager Bakke, or Amager Hill.”

See on Scoop.itGreen Building Design – Architecture & Engineering

Life-Cycle Cost Analysis (LCCA) | Whole Building Design Guide

Life-cycle cost analysis (LCCA) is a method for assessing the total cost of facility ownership. It takes into account all costs of acquiring, owning, and disposing of a building or building system. LCCA is especially useful when project alternatives that fulfill the same performance requirements, but differ with respect to initial costs and operating costs, have to be compared in order to select the one that maximizes net savings.

Source: www.wbdg.org

DESCRIPTION

A. Life-Cycle Cost Analysis (LCCA) Method

The purpose of an LCCA is to estimate the overall costs of project alternatives and to select the design that ensures the facility will provide the lowest overall cost of ownership consistent with its quality and function. The LCCA should be performed early in the design process while there is still a chance to refine the design to ensure a reduction in life-cycle costs (LCC).

The first and most challenging task of an LCCA, or any economic evaluation method, is to determine the economic effects of alternative designs of buildings and building systems and to quantify these effects and express them in dollar amounts.

lcca_2

Viewed over a 30 year period, initial building costs account for approximately just 2% of the total, while operations and maintenance costs equal 6%, and personnel costs equal 92%.
Graphic: Sieglinde Fuller
Source: Sustainable Building Technical Manual / Joseph J. Romm,Lean and Clean Management, 1994.

B. Costs

There are numerous costs associated with acquiring, operating, maintaining, and disposing of a building or building system. Building-related costs usually fall into the following categories:lcca_5

Initial Costs—Purchase, Acquisition, Construction Costs

Fuel Costs,

Operation, Maintenance, and Repair Costs

Replacement Costs; Residual Values—Resale or Salvage Values or Disposal Costs, Finance Charges—Loan Interest Payments

Non-Monetary Benefits or Costs

Only those costs within each category that are relevant to the decision and significant in amount are needed to make a valid investment decision. Costs are relevant when they are different for one alternative compared with another; costs are significant when they are large enough to make a credible difference in the LCC of a project alternative. All costs are entered as base-year amounts in today’s dollars; the LCCA method escalates all amounts to their future year of occurrence and discounts them back to the base date to convert them to present values. […]

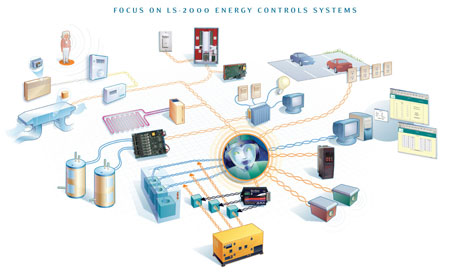
Energy and Water Costs

Operational expenses for energy, water, and other utilities are based on consumption, current rates, and price projections. Because energy, and to some extent water consumption, and building configuration and building envelope are interdependent, energy and water costs are usually assessed for the building as a whole rather than for individual building systems or components.

Energy usage: Energy costs are often difficult to predict accurately in the design phase of a project. Assumptions must be made about use profiles, occupancy rates, and schedules, all of which impact energy consumption. At the initial design stage, data on the amount of energy consumption for a building can come from engineering analysis or from a computer program such as eQuest.ENERGY PLUS (DOE), DOE-2.1E and BLAST require more detailed input not usually available until later in the design process. Other software packages, such as the proprietary programs TRACE (Trane), ESPRE (EPRI), and HAP (Carrier) have been developed to assist in mechanical equipment selection and sizing and are often distributed by manufacturers.

When selecting a program, it is important to consider whether you need annual, monthly, or hourly energy consumption figures and whether the program adequately tracks savings in energy consumption when design changes or different efficiency levels are simulated.  […]

Operation, Maintenance, and Repair Costs

(Courtesy of Washington State Department of General Administration)

Non-fuel operating costs, and maintenance and repair (OM&R) costs are often more difficult to estimate than other building expenditures. Operating schedules and standards of maintenance vary from building to building; there is great variation in these costs even for buildings of the same type and age. It is therefore especially important to use engineering judgment when estimating these costs.

Supplier quotes and published estimating guides sometimes provide information on maintenance and repair costs. Some of the data estimation guides derive cost data from statistical relationships of historical data (Means, BOMA) and report, for example, average owning and operating costs per square foot, by age of building, geographic location, number of stories, and number of square feet in the building. The Whitestone Research Facility Maintenance and Repair Cost Reference gives annualized costs for building systems and elements as well as service life estimates for specific building components. The U.S. Army Corps of Engineers, Huntsville Division, provides access to a customized OM&R database for military construction (contact: Terry.L.Patton@HND01.usace.army.mil).

Replacement Costs

The number and timing of capital replacements of building systems depend on the estimated life of the system and the length of the study period. Use the same sources that provide cost estimates for initial investments to obtain estimates of replacement costs and expected useful lives. A good starting point for estimating future replacement costs is to use their cost as of the base date. The LCCA method will escalate base-year amounts to their future time of occurrence.

Residual Values

The residual value of a system (or component) is its remaining value at the end of the study period, or at the time it is replaced during the study period. Residual values can be based on value in place, resale value, salvage value, or scrap value, net of any selling, conversion, or disposal costs. As a rule of thumb, the residual value of a system with remaining useful life in place can be calculated by linearly prorating its initial costs. For example, for a system with an expected useful life of 15 years, which was installed 5 years before the end of the study period, the residual value would be approximately 2/3 (=(15-10)/15) of its initial cost.

Other Costs

Finance charges and taxes: For federal projects, finance charges are usually not relevant. Finance charges and other payments apply, however, if a project is financed through an Energy Savings Performance Contract (ESPC) or Utility Energy Services Contract (UESC). The finance charges are usually included in the contract payments negotiated with the Energy Service Company (ESCO) or the utility.

Non-monetary benefits or costs: Non-monetary benefits or costs are project-related effects for which there is no objective way of assigning a dollar value. Examples of non-monetary effects may be the benefit derived from a particularly quiet HVAC system or from an expected, but hard-to-quantify productivity gain due to improved lighting. By their nature, these effects are external to the LCCA, but if they are significant they should be considered in the final investment decision and included in the project documentation. See Cost-Effective—Consider Non-Monetary Benefits.

To formalize the inclusion of non-monetary costs or benefits in your decision making, you can use the analytical hierarchy process (AHP), which is one of a set of multi-attribute decision analysis (MADA) methods that consider non-monetary attributes (qualitative and quantitative) in addition to common economic evaluation measures when evaluating project alternatives. ASTM E 1765 Standard Practice for Applying Analytical Hierarchy Process (AHP) to Multi-attribute Decision Analysis of Investments Related to Buildings and Building Systems published by ASTM International presents a procedure for calculating and interpreting AHP scores of a project’s total overall desirability when making building-related capital investment decisions. A source of information for estimating productivity costs, for example, is the WBDG Productive Branch.  [….]

D. Life-Cycle Cost Calculation

After identifying all costs by year and amount and discounting them to present value, they are added to arrive at total life-cycle costs for each alternative:

LCC =  I + Repl — Res + E + W + OM&R + O

LCC = Total LCC in present-value (PV) dollars of a given alternative
I = PV investment costs (if incurred at base date, they need not be discounted)
Repl = PV capital replacement costs
Res = PV residual value (resale value, salvage value) less disposal costs
E = PV of energy costs
W = PV of water costs
OM&R = PV of non-fuel operating, maintenance and repair costs
O = PV of other costs (e.g., contract costs for ESPCs or UESCs)

E. Supplementary Measures

Supplementary measures of economic evaluation are Net Savings (NS), Savings-to-Investment Ratio (SIR), Adjusted Internal Rate of Return (AIRR), and Simple Payback (SPB) or Discounted Payback (DPB). They are sometimes needed to meet specific regulatory requirements. For example, the FEMP LCC rules (10 CFR 436A) require the use of either the SIR or AIRR for ranking independent projects competing for limited funding. Some federal programs require a Payback Period to be computed as a screening measure in project evaluation. NS, SIR, and AIRR are consistent with the lowest LCC of an alternative if computed and applied correctly, with the same time-adjusted input values and assumptions. Payback measures, either SPB or DPB, are only consistent with LCCA if they are calculated over the entire study period, not only for the years of the payback period.

All supplementary measures are relative measures, i.e., they are computed for an alternative relative to a base case.  […]”<

See on Scoop.itGreen Building Design – Architecture & Engineering

Hospital Retrofits Heating and Domestic-Hot-Water Systems For Substantial Energy Savings

At Holton Community Hospital in rural Holton, Kan., two cast-iron atmospheric boilers and three gas-fired water heaters that had been in place for nearly 20 years were operating inefficiently.

Source: hpac.com

>” […] Based on the boiler-plate outputs and firing rates of the existing boilers and domestic water heaters at design conditions and outputs, three Knight XL heating boilers with inputs of 500,000 Btuh, two 119-gal. Squire indirect water heaters, and a 119-gal. buffer tank were selected. […]

On one of the Knight XL heating boilers, a Grundfos MAGNA3 variable-speed circulator pump was installed. The boiler controls the speed of the pump using the built-in Smart System. When the boiler modulates down, the pump slows to maintain a constant temperature rise across the heat exchanger at all times. Reducing pump revolutions reduces power consumption tremendously.

Monitoring equipment was placed on both the lead boiler and the member boiler not dedicated to domestic water. The lead boiler had the MAGNA3 40-80 F variable-speed circulator pump, while the member boiler used the UPS 43-100 F constant-speed circulator pump.

For analysis, the team compared two similar days, March 20 and 21, at a time when only the two monitored boilers would be running. At that time, domestic water use would be unlikely, reducing the chance the third boiler would fire and affect the measured values.Figure 1 shows the power consumed by the constant-speed circulator and the variable-speed circulator when each was the lead.

Lochinvar Chart2_AMD

FIGURE 1. Pump power consumption.


Pump-speed modulation resulted in significant energy savings. The MAGNA3 reached a maximum power usage of 270 W, but slowed to a minimum of just over 50 W, while the UPS ran at a continuous 365 W. Over the course of the hour, the MAGNA3 averaged 156 W.

With Smart System, the boiler adjusts the flow through its heat exchanger to control delta-T as well as system median temperature. Delta-T across the boiler is constant, resulting in enhanced building comfort, increased heat transfer, and electricity savings.

In January 2014, Holton Community Hospital spent a total of $1,207.31 on gas and electricity. In comparison, the hospital’s gas and electricity bills for January 2013 were $2,805.41—more than twice as much. […]”<

See on Scoop.itGreen Building Operations – Systems & Controls, Maintenance & Commissioning

Energy Efficiency in Buildings – How VFD’s Save Energy

Have you wondered why Pumps and Fans are such a great opportunity to save energy using variable speed drives? ABB can help you estimate your energy savings a…

Source: www.youtube.com

>”  Efficiencies of Motors and Drives

The full load efficiency of AC electric motors range from around 80% for the smallest motors to over 95% for motors over 100 HP. The efficiency of an electric motor drops significantly as the load is reduced below 40%. Good practice dictates that motors should be sized so that full load operation corresponds to 75% of the rated power of the motor. […]

The efficiency of an electric motor and drive system is the ratio of mechanical output power to electrical input power and is most often expressed as a percentage.

Motor System Efficiency =Output MechanicalInput Electrical x 100%

A VFD is very efficient. Typical efficiencies of 97% or more are available at full load. At reduced loads the efficiency drops. Typically, VFDs over 10 HP have over 90% efficiency for loads greater than 25% of full load. This is the operating range of interest for practical applications. […]

The system efficiency is lower than the product of motor efficiency and VFD efficiency because the motor efficiency varies with load and because of the effects of harmonics on the motor.

Unfortunately, it is nearly impossible to know what the motor/ drive system efficiency will be, but because the power input to a variable torque system drops so remarkably with speed, an estimate of the system efficiencies is really all that is needed.

When calculating the energy consumption of a motor drive system, estimated system efficiency in the range of 80-90 % can be used with motors ranging from 10 HP and larger and loads of 25% and greater.

In general, lower efficiency ranges correspond to small motor sizes and loads and higher efficiency ranges corresponds to larger motors and loads.

b. Comparison with Conventional Control Methods

Estimating Energy Savings

Fans and pumps are designed to be capable of meeting the maximum demand of the system in which they are installed.

However, quite often the actual demand could vary and be much less than the designed capacity. These conditions are accommodated by adding outlet dampers to fans or throttling valves to pumps.

These are effective and simple controls, but severely affect the efficiency of the system.

Using a VFD to control the fan or pump is a more efficient means of flow control than simple valves or inlet or outlet dampers. The power input to fans and pumps varies with the cube of the speed, so even seemingly small changes in speed can greatly impact the power required by the load. […]

In addition to major energy savings potential, a drive also offers built-in power factor correction, better process control and motor protection. […]”<*

* Extracted from:  http://www.nrcan.gc.ca/energy/products/reference/15385

See on Scoop.itGreen Building Design – Architecture & Engineering

Reduce Costs and Energy Use Through Elevator Efficiency Upgrades

Buying or installing elevator equipment that promotes low-energy consumption can help save money and reduce a building’s environmental footprint.

Source: highrisefacilities.com

>”As part of a building’s overall energy usage, elevators consume up to 10 percent of the total energy in a building. From an environmental standpoint, the most significant impact elevators have is the electricity use while the elevator is in service. Therefore, buying or installing elevator equipment that promotes low-energy consumption can help save money and reduce a building’s environmental footprint.

Buildings and Energy

One way to measure overall energy usage is by calculating the power factor (PF) of the building and/or its energy-consuming devices. These are generally motors, transformers, high intensity discharge (HID) lighting, fluorescent devices or other pieces of equipment that require magnetism to operate. […]

Power factor is a measurement of electrical system efficiency in the distribution and consumption of electrical energy. It is the percentage of the amount of electric power being provided that is converted into real work and expressed as a number between zero and one. For example, if a device had a .70 PF, then 70 percent of the power that the utilities generate to run the device is actually being converted into real work. The lower the PF number, the poorer the PF efficiency. The higher the PF number, the greater the PF efficiency.

In some areas, utilities use PF in the computation of the demand charge. A low PF for a customer’s facility could result in a demand charge penalty that increases the monthly demand cost. This is where newer, more innovative elevator control systems can contribute to lower energy consumption and improve a buildings’ overall PF.

Because of electrical losses caused during generation, distribution and consumption of electricity, the amount of power needed to be provided by a utility company will be greater than the amount for which they get paid by consumers.

Comparative Analysis

During a recent modernization of two identical traction elevators, before and after energy data was collected. The original, first generation silicon controlled rectifier (SCR), direct current (DC) motor control was measured using a series of fixed run patterns and known loads. After modernization, the new insulated-gate bipolar transistor (IGBT)-based alternating current (AC) motor control for a permanent magnet synchronous motor system was measured using the same run patterns and known loads.

The SCR-DC system used far more energy (watts/hour) to move the exact same load through the exact same distance compared to the IGBT-based permanent magnet AC control (Chart 1). In fact, in these six load tests, the IGBT-based system used less than half the energy. An incredible 383 percent increase in power factor of the IGBT-based system compared to the SCR-DC system (Chart 2). That means more of the energy consumed was being converted into real work with less waste in terms of heat and magnetism.

These kinds of energy usage reductions and PF increases are becoming even greater as newer elevator technology gets incorporated into buildings (Chart 3).

It’s easy to see how reducing energy consumption and increasing power rating can benefit the building’s owners and operators. However, these same improvements benefit the community as well. The electricity not being used in one building can be used by other customers — allowing utilities to meet the community’s electricity demand without increasing electricity generation. That translates into no rolling blackouts or brownouts, no new power plants being built and an overall smaller environmental footprint.

Hydraulic Elevators

Up to this point, traction elevator technology was discussed where wire ropes pull the elevator from above the car. In contrast, the hydraulic elevator pushes the elevator cab through the hoistway. The way a hydraulic system works is a piston and cylinder are sunk in the ground below the elevator. To go up, a pump forces oil from an oil tank reservoir into the cylinder — causing the piston to rise, making the elevator cab go up. To go down, gravity and the weight of the cab pushes the piston down into the cylinder and forces the hydraulic oil back into the tank reservoir. Historically, hydraulic elevators (or hydros) have been installed where either the building had fewer floors (typically six to eight) or lower material and installation costs were a consideration (when compared to a traction elevator). […]

Considerations Beyond the Hoistway

Energy reduction of a building’s elevators can also impact heating, ventilation and air conditioning (HVAC) systems. Quite often, elevator machine rooms are air conditioned to support removal of the heat generated by elevator control systems. Motor-generator-based elevator controls create a tremendous amount of heat; the effect is multiplied when several systems are contained in the same machine room.

Additionally, a check should be made of the shut-down timer typically employed with motor-generators (M-G) sets. Is it working? Does the M-G set turn off after a set period of time? Or has the timer failed and no longer shuts down the motor-generator, wasting energy as the M-G set turns but no work is being done by the elevator?

The elevator cab’s lighting can impact both the energy consumption and HVAC systems. A recent survey conducted of a 34-story high rise office building with 18 elevators showed the cab lights were on 24-hours a day. There are 28 incandescent light bulbs per elevator. That worked out to 100-amps of power being consumed continuously. By replacing the incandescent bulbs with compact fluorescents, energy consumption could be cut to 30 percent. And if a 24-hour clock timer is added to shut the lights off at midnight, even more energy could be saved.

Reducing Energy Consumption

Finally, if you’re considering an elevator modernization, call your electric provider or visit their Website to explore the possibility of energy rebates from the local utility provider. It is quite common for utilities to offer dollar incentives for specific building improvements that reduce energy consumption and improve PF.

There are various benefits to building owners and facility managers who lower their power consumption and understand how power factor helps reduce the overall cost of energy, particularly the energy used to run the elevators in their buildings. These benefits go beyond the elevators themselves to include benefits derived from HVAC systems, cab lighting and energy consumed when the elevators are not moving that affect the monthly utility bill.”


See on Scoop.itGreen Energy Technologies & Development

Study Finds Global Opportunities for Improvements in Elevator Efficiency

1259707a-d405-4e90-9e4b-4b7660c1a1d0.jpgElevators and escalators make up 2 to 5 percent of the energy used in most buildings, but can reach as high as 50 percent during peak operational times. At 5 percent, that means the yearly energy consumption of U.S. elevators is approximately five times of that used in all of Washington D.C.


image source: http://www.thyssenkrupp.com/en/produkte/energieeffiziente-aufzugssysteme.html

Source: aceee.org

>”Chicago—More energy-efficient elevators can significantly reduce the costs of operating a building, but the information needed to help building owners identify the appropriate elevator system—and the savings associated with it—aren’t readily available, according to a new study published by a leading policy group. The study, by the American Council for an Energy-Efficient Economy, was published with the support of UTC Building & Industrial Systems, the parent organization of Otis, the world’s largest manufacturer and maintainer of people-moving products.

[…] The technology exists today to reduce that consumption by 40 percent or more, especially by cutting energy use between trips, when an elevator is idle, according to the study. Some technologies have been found to reduce consumption by as much as 75 percent, but without a standard way to measure energy savings and a rating system to distinguish more efficient elevators, building owners may be unaware of the benefits of upgrading to a more efficient system or choosing a more efficient system for new construction.

“Enhanced visibility when it comes to elevator efficiency can help customers grasp the full value package of better controls, improved performance, reduced sound, and increased comfort,” said Harvey Sachs, ACEEE senior fellow, and the study’s lead author. Sameer Kwatra of ACEEE presented the study on Tuesday, January 27 at the 2015 American Society of Heating, Refrigerating and Air-Conditioning Engineers (ASHRAE) Winter Conference in Chicago.

The study lays out a framework for industry leaders to set common standards for measuring elevator efficiency. Those standards could lead to a rating system, such as the U.S. Environmental Protection Agency’s ENERGY STAR® ratings already in place for heating, ventilating and air-conditioning systems, and many home appliances. Clear standards also could lead energy utilities and government agencies to offer incentives, such as rebates, for very efficient models. And building label programs, such as the U.S. Green Building Council’s LEED® program, could include elevator efficiency as a factor in certifying buildings. Right now, the LEED program considers elevators a part of unregulated “process loads,” and there are no direct credits for installing more efficient systems.

“Owners see elevators as an extension of the building lobby — a way to include their personality and values in the building,” said John Mandyck, chief sustainability officer, UTC Building & Industrial Systems. “As consumers and tenants better understand and value the effects green buildings have on the health and productivity of inhabitants, clear standards for measuring elevator efficiency can provide a great opportunity to reduce operating costs and showcase the environmental attributes of a building.”

The report identified energy-efficient elevator technologies that can be included in building codes and factored in elevator rating and labeling systems. […]”<

See on Scoop.itGreen Building Design – Architecture & Engineering

Energy Efficiency, the Invisible fuel

THE CHEAPEST AND cleanest energy choice of all is not to waste it. Progress on this has been striking yet the potential is still vast. Improvements in energy…

Source: www.economist.com

>”[…] The “fifth fuel”, as energy efficiency is sometimes called, is the cheapest of all. A report by ACEEE, an American energy-efficiency group, reckons that the average cost of saving a kilowatt hour is 2.8 cents; the typical retail cost of one in America is 10 cents. In the electricity-using sector, saving a kilowatt hour can cost as little as one-sixth of a cent, says Mr Lovins of Rocky Mountain Institute, so payback can be measured in months, not years.

The largest single chunk of final energy consumption, 31%, is in buildings, chiefly heating and cooling. Much of that is wasted, not least because in the past architects have paid little attention to details such as the design of pipework (long, narrow pipes with lots of right angles are far more wasteful than short, fat and straight ones). Energy efficiency has been nobody’s priority: it takes time and money that architects, builders, landlords and tenants would rather spend on other things.

In countries with no tradition of thrifty energy use, the skills needed are in short supply, too. Even the wealthy, knowledgeable and determined Mr Liebreich had trouble getting the builders who worked on his energy-saving house to take his instructions seriously. Painstakingly taping the joins in insulating boards, and the gaps around them, seems unnecessary unless you understand the physics behind it: it is plugging the last few leaks that brings the biggest benefits. Builders are trained to worry about adequate ventilation, but not many know about the marvels of heat exchangers set in chimney stacks. […]

One answer to this market failure is to bring in mandatory standards for landlords and those selling properties. Another involves energy-service companies, known as ESCOs, which guarantee lower bills in exchange for modernisation. The company can develop economies of scale and tap financial markets for the upfront costs. The savings are shared with owners and occupiers. ESCOs are already a $6.5 billion-a-year industry in America and a $12 billion one in China. Both are dwarfed by Europe, with €41 billion ($56 billion) last year. Navigant Research, the consultancy, expects this to double by 2023.

That highlights one of the biggest reasons for optimism about the future of energy. Capital markets, frozen into caution after the financial crash of 2008, are now doing again what they are supposed to do: financing investments on the basis of future revenues. The growth of a bond market to pay for energy-efficiency projects was an encouraging sign in 2014, when $30 billion-40 billion were issued; this year’s total is likely to be $100 billion.

“The price of fossil fuels will always fluctuate. Solar is bound to get cheaper”

Solar energy is now a predictable income stream drawing in serious money. A rooftop lease can finance an investment of $15,000-20,000 with monthly payments that are lower than the customer’s current utility bill. SolarCity, an American company, has financed $5 billion in new solar capacity, raising money initially from institutional investors, including Goldman Sachs and Google, but now from individual private investors—who also become what the company calls “brand ambassadors”, encouraging friends and colleagues to install solar panels too.

The model is simple: SolarCity pays for the installation, then bundles the revenues and sells a bond based on the expected future income stream. Maturities range from one to seven years. The upshot is that the cost of capital for the solar industry is 200-300 basis points lower than that for utilities. […]”<

See on Scoop.itGreen & Sustainable News

Continuous Monitoring Solution Designed for Facility and Energy Management

Verisae and Ecova partner to combine technology and service across nearly 3,000 facilities for an innovative and smart operational approach …


image source: http://energymanagementsystems.org/faqs-on-developing-energy-management-systems/

Source: www.virtual-strategy.com

>” Verisae, a leading global provider of SaaS solutions that drive cost reductions in maintenance, energy, mobile workforces, and environmental management, and Ecova, a total energy and sustainability management company, are pleased to announce the success of their growing partnership to help multisite companies solve their toughest energy, operations, and maintenance challenges.

The continuous monitoring solution combines Verisae’s Software-as-a-Service (SaaS) technology platform with Ecova’s Operations Control Center (OCC) to empower data-driven decision making. The solution analyses operational data in real-time, and has the capability to look for issues and anomalies to predict equipment failure and automatically identify inefficiencies causing higher energy consumption.

Ecova’s fully-staffed 24/7/365 OCC investigates inbound service calls, alarms, telemetry data, and work orders to determine the source of energy, equipment, and system faults and, where possible, corrects issues remotely before they escalate into financial, operational, or comfort problems. Trouble tickets and inbound calls are captured and tracked in the Verisae platform to provide companies with visibility into any operational issues. Combining data analytics that flag potentially troubling conditions with a service that investigates and resolves issues increases operational efficiencies and improves energy savings.

“Companies are constantly challenged to cut costs while maintaining quality, performance, and comfort,” says Jerry Dolinsky, CEO of Verisae. “Our combined solution helps clients address these challenges so they can reduce costs and improve operational efficiencies without impacting value.”

[…] “<

See on Scoop.itGreen Energy Technologies & Development

Building Recommissioning: Recertifying To LEED Platinum EB+OM

The facilities management director for Armstrong World Industries shares insights into the company’s LEED Platinum recertification pursuit.

Source: facilityexecutive.com

>” […] Q: When the LEED recertification process began for the Armstrong Headquarters facility (Building 701), how did you and the rest of the team begin evaluating the status of the building, in terms of its readiness to be re-certified?

A: Since our initial certification in 2007, we had established specific policies/procedures to follow for the building.  We had these in place so it was more a matter of reviewing what information was needed and fine tuning some of our data processes.  We continue to utilize our building automation system (Johnson Controls Metasys) for controlling all of our building systems and collect much of our operational data through that system. During our performance period, we read our data points on a more frequent basis to understand if systems were operating as designed. If readings were off, metrics signaled a physical change to be made to improve operations and data.

One surprise to our team was our Energy Star score.  We realized we had some searching to do when we saw that our building score had dropped below the 90’s where it had been in 2012. However, to recertify and meet the prerequisite for the E&A category, our Energy Score needed to be 70, and we met that.

In short, our recommissioning process helped us pinpoint many opportunities for improving building operations.

Q: For the recertification, which systems or strategies were newly introduced to the facility?

A: As a building owner, you are always thinking about improving building operations along with budgeting dollars to make the changes. Items that were budgeted for 2014 that were included in our building recertification included: a new roof with an SRI (Solar Reflectance Index) of 78; LED lamp replacements in the lobby; and electrical sub-meters for building lighting.

One other item that was completed in 2010 after electrical deregulation was daylight housekeeping. We traditionally did our housekeeping from 5 pm to midnight. However, as we reviewed our electrical costs and determined a savings opportunity, we moved to daytime hours for cleaning. This saved Building 701 approximately $750 weekly in energy costs. We implemented daylight housekeeping across the entire corporate campus, saving the company $150,000 annually in energy costs.

Q: What is the most challenging aspect of running a LEED Platinum facility? And what is most rewarding?

A: The most challenging aspect of operating and maintaining a LEED- EBOM facility is making sure you have qualified and trained technicians to understand and manage the building operations.

The most rewarding aspect is meeting with customers and guests to discuss the sustainable characteristics of the building and thinking about what to budget for in the upcoming year to improve overall building operations and maintenance to reduce costs. […] “<

See on Scoop.itGreen Building Operations – Systems & Controls, Maintenance & Commissioning

New Boston Start-up Tracks Multifamily Residential Energy Efficiency “Score”

wego_screen_shotWegoWise Inc., which provides energy analytics to private property owners and public housing entities, last week launched WegoScore, a rating system that assesses buildings in three areas, energy, water and carbon and then spits out a score between one and 100.

Source: www.bizjournals.com

>” […] “We are focusing on a universal approach with meaningful reductions,” WegoWise founder and CTO Barun Singh said of the platform.

With the water crisis in California and with 39 percent of carbon dioxide coming from buildings, property owners and public housing agencies are making energy-saving retrofits and want to market what they’ve done.

Those buildings that reach a high rating are issued certificates and decals to let the world know they are more efficient. Maloney Properties Inc., a Wellesley-based real estate management, sales and construction firm with 350 buildings, is featuring its decal proudly. Other area companies include Peabody Properties in Braintree and Homeowners Rehab, based in Cambridge.

The score not only brings awareness to a building’s efficiency, it also provides a way for property owners to market the value of the work completed in their buildings to perspective tenants who are concerned about the environment, Singh said. And the stickers are a fun way to market their accomplishments.

After using WegoWise, Maloney Properties was able to find $2.5 million in 2014 retrofits and expects to save 10 to 20 percent on utility costs related to the retrofits annually. John Magee, an assistant facilities director at Maloney, said the real estate company has been looking for a way to market the value of its properties. And now, the WegoScore will enable it to do that.

With the $4.9 million in funding it has raised from Boston Community Capital, WegoWise was able to build a portfolio of 23,000 multifamily buildings covering more than 600 million square feet. With all of the data that WegoWise has collected since its launch in 2010, coming up with a rating system would be a simple solution, right? Not exactly, according Singh.

Launching WegoScore was an expensive and lengthy process for the 25-person company, he said. Before launching the rating system, Singh said he wanted to be sure that had enough data to come up with a score that was meaningful.

“The end result is a straight-forward algorithm,” he said.

The WegoScore is currently only available for multifamily buildings, according to the company. Scores will be refreshed on a weekly basis and stickers are awarded twice a year.

In addition to gaining interest from its existing customers, venture-backed WegoWise is also garnering the attention of other potential partners including banks, who could use the score as a way to get a sense of the building and decide whether or not to lend to them, and insurance providers that would make decisions based on the building’s efficiency score and other factors. […]”<

See on Scoop.itGreen Building Operations – Systems & Controls, Maintenance & Commissioning