Top Ten Most Viewed Articles of 2015

Water Vortex

Photo:  Top Viewed Article of the year on Water Vortex Hydro-Electric Power Plant Designs

This is going to be a fun post to write, as I get to review the statistics for 2015 and pick out the ten most viewed posts on my blog for the year.  I am looking forward to performing this review, as I get to find out what works and what does not.  The idea being to give me a chance to refine my techniques and improve my blog posts.

I am listing them in reverse order as we want to heighten the suspense, leading up to the most viewed article.  Each post will also have the posting date and number of views for comparison.  I know this technique is not perfect as some posts will have a longer opportunity to be seen than those written later in the year.  Such discrepancies will be left to discussed in a future article.

10.  Climate Change, Pole Shift & Solar Weather

Magnetic pole shift

This post discusses Earth’s wandering magnetic poles, the fluctuating field strengths and links to solar weather and climate change.  Some rather eccentric, yet plausible explanations based on historical data that pole shifts are possible and have happened, at unpredictable, largely spaced intervals of hundreds of thousands to millions of years, the average being 450,000 years.

Posted on March 3, 2015 and received 44 views.

9.  Leaked HSBC Files from Swiss Bank lead to Tax Evasion and Money Laundering charges

HSBC Scandal

Headline tells it all.  Large bank caught helping clients evade taxes and launder illegally obtained money through bank accounts.

Posted on February 9, 2015 and received 48 views.

8.  Michigan’s Consumers Energy to retire 9 coal plants by 2016

Michigan Coal Plant

Coal is unclean to burn and becoming costly to do operate due to emissions, resulting in coal fired plant closures, 9 by one Michigan utility.

Posted on February 10, 2015 and received 50 views.

7.  Life-Cycle Cost Analysis (LCCA) | Whole Building Design Guide

lcca_2

This article simply reprises, in part, the LCCA (Life-Cycle Cost Analyisis) procedure used for buildings as originally posted by WBDG.

Posted on February 15, 2015 and received 57 views.

6.  Energy Efficiency Development and Adoption in the United States for 2015

energy efficiency adoption

The article discusses the role of large scale energy efficiency programs as an investment and means to achieve certain goals when viewed as the “cheapest” fuel.  The graphic depicts a hierarchy of waste minimization correlating to cost and energy usage and effects with the environmental resources.

Posted on January 8, 2015 and received 59 views.

5.  Renewable Energy Provides Half of New US Generating Capacity in 2014

Renewable Energy

According to the latest “Energy Infrastructure Update” report from the Federal Energy Regulatory Commission’s (FERC) Office of Energy Projects, renewable energy sources (i.e., biomass, geothermal, hydroelectric, solar, wind) provided nearly half (49.81 percent – 7,663 MW) of new electrical generation brought into service during 2014 while natural gas accounted for 48.65 percent (7,485 MW).

Posted on February 4, 2015 and received 62 views.

4.  Cover-up: Fukushima Nuclear Meltdown a Time Bomb Which Cannot be Defused

260px-Fukushima_I_by_Digital_Globe

Tens of thousands of Fukushima residents remain in temporary housing more than four years after the horrific disaster of March 2011. Some areas on the outskirts of Fukushima have officially reopened to former residents, but many of those former residents are reluctant to return home because of widespread distrust of government claims that it is okay and safe.

Posted on July 22, 2015 and received 65 views.

3.  Apple to Invest $2 Billion in Solar Farm Powered Data Center Renovation in Arizona

Apple

The company plans to employ 150 full-time Apple staff at the Mesa, Arizona, facility… In addition to the investment for the data center,  Apple plans to build a solar farm capable of producing 70-megawatts of energy to power the facility.  […] Apple said it expects to start construction in 2016 after GT Advanced Technologies Inc., the company’s sapphire manufacturing partner, clears out of the 1.3 million square foot site.

Posted on February 11, 2015 and received 73 views.

2.  Determining the True Cost (LCOE) of Battery Energy Storage

Energy Storage

With regard to [battery] energy storage systems, many people erroneously think that the only cost they should consider is the initial – that is, the cost of generating electricity per kilowatt-hour. However, they are not aware of another very important factor.  This is the so-called LCOE,  levelized cost of energy (also known as cost of electricity by source), which helps calculate the price of the electricity generated by a specific source.

Posted on January 27, 2015 and received 109 views.

1. Water Vortex Hydro-Electric Power Plant Designs

Water Vortex

Austrian engineer Franz Zotlöterer has constructed a low-head power plant that makes use of the kinetic energy inherent in an artificially induced vortex. The water’s vortex energy is collected by a slow moving, large-surface water wheel, making the power station transparent to fish – there are no large pressure differences built up, as happens in normal turbines.

Posted on June 11, 2015 and received 109 views.


Alberta Energy Production And A Renewable Future

Author:  Duane M. Tilden, P.Eng  (January 14th, 2016)

Abstract:  Energy sources and pricing are hot topics world-wide with the Climate Change agenda leading the way.  Last year at the 2015 Paris Climate Conference long-term goal of emissions neutrality was established to be by as soon as 2050.  Alberta currently produces more atmospheric carbon emissions and other pollutants than any other Province in Canada, and in order to meet clean air objectives the energy sectors which consume & mine the natural resources of the Province will have to shift to non-polluting & renewable energy sources and be more efficient in energy utilization.  To achieve these goals new infrastructure will have to be built which will have the likely consequences of raising energy pricing as well as alter consumption rates and patterns.

Transportation

Transportation is a vital link in modern society, and often a personal vehicle is chosen as the main mode of mobility to work, leisure, & social purposes.  Cars and trucks also provide means of work and commerce & are essential to our way of life.  Most of these vehicles are fueled by gasoline, some by diesel, propane, and more recently the electric vehicle (EV) and hybrids.


GraphData Gas Price Comparison Canada

Graph #1:  Average Cost Comparison of Gasoline in Major Canadian Cities

In Alberta, using Calgary as a basis for comparison, it is apparent that pricing to consumers for gasoline is below nation-wide market averages when measured Province by Province, as demonstrated in Graph #1 (1). While if you live in Vancouver the cost is considerably higher, due to included carbon taxes and a transit levy among additional charges.  Additional means of moving growing populations efficiently have been seen by the development of LRT mass transit for the rapid movement of citizens to work, school, or social events.

Rapidly moving the large segments of the population in a cost effective manner is important to growth.  Buses are an important link in this mix as are cycling routes, green-ways and parks.  Changes in fuels for trucks, buses and trains by converting from diesel fuel to LNG will also provide for reductions in emissions while providing economic opportunity for utilization of the existing plentiful resource.  While EV’s show promise, the battery technologies for energy storage need further development.

Alberta Electricity Production

Alberta still relies on out-dated coal plants to generate electricity.  According to a CBC article coal provides power to 55% of homes in Alberta, and is the second largest contributor to emissions (2) and GHG’s to the Oil Sands projects.  However, it has been noted that the utility is reluctant to decommission recently constructed coal plants, until they have earned back (or are compensated for) their investment in capital costs.

local-input-wabamun-alberta-march-21-2014-a-giant-drag1

Photo #1:  Highvale coal mine to feed the nearby Sundance power plant (3)  

Photo credit:  John Lucas / Edmonton Journal

There are power purchase agreements in place, which may extend 50 to 60 years from the construction date of the plant (2).  It may be possible that the coal fired power plants could be converted to burn natural gas, which Alberta has in abundance, rather than be decommissioned.  However, this would still require the closure of the coal mines and mining operations currently supplying the existing power plants.  Also, combustion of natural gas will still release GHG’s into the atmosphere, while less than coal, they are not a total elimination of emissions.

Residential Energy Consumption

When comparing monthly residential electrical energy costs across Canada, using data obtained from a survey performed by Manitoba Hydro, we see that Edmonton and Calgary are in the lower middle range of pricing (4).  Variances in all regions will occur based on average home size, building codes and insulation requirements, heating system types and other factors.  Some homes may be heated with electric baseboard which will result in a higher electric bill while other homes may be heated using natural gas as a fuel.  Also household hot water generation can be by electric or gas-fired heater, so consumption of natural gas must be considered with electrical power usage to get a complete picture of energy consumption.

residential_1000kWhresidential_2000kWh

Charts #1 & 2:  Average Monthly Cost For Residential Electricity in Major Canadian Cities For Equivalent Usage in kWh (4)

Inspecting these charts it is proposed that a price increase of 10 to 20% to Alberta electrical energy consumers by a separate tax or fee to pay for a shift in technology would be reasonable when compared to other Canadian Cities.   Additional tariffs on natural gas consumption would also be recommended.  Such an increase would likely have a secondary benefit of creating an incentive for energy efficiency upgrades by home owners such as increased insulation, better windows and heating system upgrades. Such improvements would in turn lead to reduced demand at the source and thus to lower GHG & particulate emissions to the atmosphere.

Climate and the Proposed Energy Code

Energy consumption in populations is normalized in a number of ways, generally defined by habits and patterns.  We observe that in traffic as volumes increase early in the morning as commuters travel to work, and in the opposite direction as they head home in the evening.  Often people will attempt to “beat the traffic”.  This is an admirable goal in energy usage as well, for consumption of electricity will follow other such predictable patterns as people eat meals, shower, and perform other rituals that interface with electrical,  heating,  ventilating, elevators, water supply and disposal systems that form infrastructure and services provided by municipalities and utilities.

As these systems need to be energized and maintained, it is desirable to be able to predict and control the consumption and distribution of resources.  The greater of these is the electrical generation and distribution system.   Also, emerging technological advancements in energy efficiency such as CFL, LCD displays, computers, refrigeration, energy storage and more.  Advancements in co-generation, district energy systems, and other end use distribution of energy which provide economies of scale are also possible as strategies to obtain goals.Heating Degree Days - Lower Western Canada

Map #1:  Partial Map of Heating Degree Days for South-Western Canada (5)

Opportunities will exist for building mechanical system enhancements and upgrades as they may provide energy savings and cost reductions to users often calculated with a minimum nominal payback period of 5 to 7 years (and should be determined in every case).   The HDD map can provide a source of information which is used in energy models to determine predicted building energy costs when calculating payback periods to justify system upgrades or design decisions.  Obtaining and monitoring building energy consumption rates and year over year changes are important resources in determining where systems are running at below optimal rates and require replacement.

In new building construction the National Energy Code for Buildings 2011 (NECB) (6) has been adopted by Alberta (7) for all municipalities.  As there are higher HDD values attributed to Calgary and Edmonton as seen in the HDD Map of Western Canada, a requirement for stringent construction methods and materials to higher standards ensure new buildings meet carbon emissions reduction goals.

026

Photo #2:  Construction of Towers in Calgary with High Window to Wall Ratios 

Photo Credit: Duane Tilden P.Eng

Increased requirements in glass U-values and shading coefficients, maximum window to wall ratios (WWR) to reduce undesirable solar heat gain and heat losses, energy consumption and improve occupant comfort.  Buildings with excessive glazing are difficult to heat and cool, requiring sophisticated mechanical systems to offset poor performance by the building envelope.

Code mandated higher insulation values & better materials; moisture and heat control of the envelope through better design.  Higher efficiency requirements for mechanical systems; (fans & ducts, pumps & pipes, and wires & motors), lighting, controls, and other components of the building and it’s envelope.  Energy modeling should be performed of larger significant buildings to optimize operations in the design phase.  Commissioning of the building is integral to ensuring compliance throughout the project to it’s final phases at substantial completion and occupancy.

Renewable Energy

Renewable energy technologies including solar power and wind generation  have been gaining rapid adoption elsewhere in the world, while in Alberta (8) carbon based fuels currently provide over 80% of electrical power generation.   This has not been for a lack of wind and solar resources in Alberta but to be attributed to the large capital investments in fossil fuel resource extraction.  Other renewable technologies such as bio-mass, hydro, and geothermal may also be employed and should be investigated as alternatives to existing thermo-electric power plants.

Alberta Energy Sources - 2015

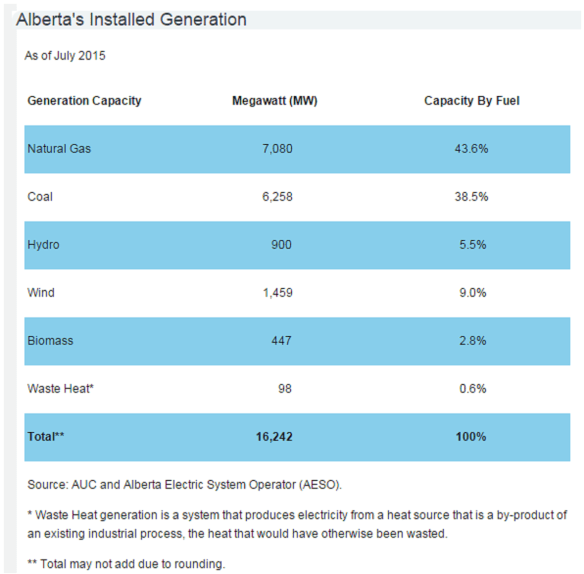
Table #1:  Installed Electrical Generating Capacity by Fuel Source in Alberta (8)

Currently, Alberta has the third highest installed wind power capacity in Canada behind Ontario and Quebec.  Wind energy not only represents a means to green the power production, it also will contribute jobs and income to the economy.  As one source of electricity and revenues is removed another source will fill the void.

installed_capacity_e-4

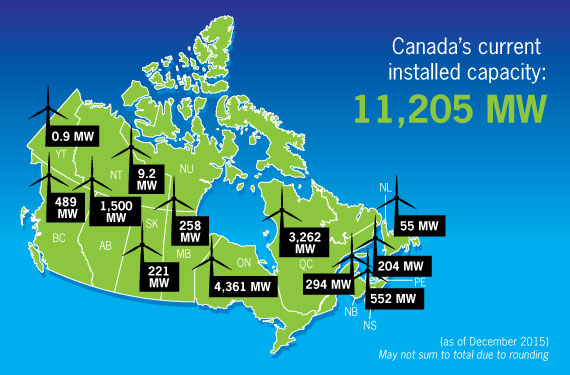
Map #2:  Installed Wind Power Capacity by Province in Canada (9)

While significant inroads have been made in Alberta for wind power which is already established as a major power source for the future, there is unrealized potential for the installation of solar power production.  It has been noted that a photo-voltaic installation in Calgary is 52% more efficient than one installed in Berlin, Germany.  Meanwhile, Germany has 18,000 times more solar power generation capacity than installed in Alberta (10).

alberta-germanytiltweb

Map #4:  Solar Resource Comparison for Alberta & Germany (10)

Alberta has significant solar resources, even during the winter when daylight hours are shorter. Lower temperatures improve PV efficiency, and properly tilted south facing panels optimize light capture, while the flat terrain of the prairies provide unobstructed maximum daylight.  Light reflection by snow on the ground would further enhance light intensity during the colder months.  Thus solar represents a relatively untapped potential source of significant electrical power for Alberta and an unrealized economic opportunity for consumers and industry.

hotspots_13

hotspots_leg

Map #5:  Solar Resource Map for Canada With Hotspots (11)

Energy Efficiency, Smart Grid & Technological Advancements

Renewable energy produces electricity from natural resources without generating carbon and particulate emissions.  Another method of controlling emissions is to reduce the amount of energy consumed by being more efficient with the energy we already produce.   We can achieve this by using higher efficiency equipment, changing consumer patterns of use to non-peak periods, use of Smart Meter’s to monitor consumer usage and to alert homeowners when there is a problem with high consumption which could result in higher bills than normal if the problem remained unreported.

There are other advancements in the electrical grid system which are on the horizon which will enable a utility maximize resources by such means as energy storage, micro-grids, demand response to name a few.  Also, property owners and businesses could be able to grid-tie private solar panel (PV) and storage systems to supplement the utilities electrical system with additional power during the day.

Summary

In order to meet the goal of atmospheric emissions neutrality as agreed to at the 2015 Paris Climate Conference Alberta is posed with making decisions on how electricity is to be produced in the future.  Eliminating coal power plants and replacing them with Renewable Energy power sources such as solar and wind power are proven methods to reducing GHG and particulate emissions as these power sources do not involve combustion and discharge of waste gases formed during the combustion process.  Coal combustion is well documented as a major contributor of GHG’s to the atmosphere.

To make the transition will require capital for financing to build new infrastructure.  Funding of these projects should be raised proportionally charged to users with increased rates.  These rate increases will provide further incentives to reducing energy consumption and thus air emissions.  Jobs will shift and employment will be created in new forms as the old is phased out and replaced with new technology.  These new systems will have to be designed, built and maintained while the workforce will require training in new methods.  There will be many new opportunities for growth and advancement resulting from the implementation of these changes to meet Canada’s International commitments.

References:

  1. http://www.nrcan.gc.ca/energy/fuel-prices/4593
  2. http://www.cbc.ca/news/business/coal-compensation-power-alberta-1.3321467
  3. http://edmontonjournal.com/business/local-business/albertas-commitment-to-phase-out-coal-fired-power-sparks-fears-of-job-losses
  4. https://www.hydro.mb.ca/regulatory_affairs/energy_rates/electricity/utility_rate_comp.shtml
  5. http://ftp2.cits.rncan.gc.ca/pub/geott/atlas/archives/english/5thedition/environment/climate/mcr4033.jpg
  6. http://www.nrc-cnrc.gc.ca/eng/publications/codes_centre/necb_2011_adaptation_guidelines.html
  7. http://www.municipalaffairs.alberta.ca/CP_Energy_Codes_Information
  8. http://www.energy.alberta.ca/electricity/682.asp
  9. http://canwea.ca/wind-energy/installed-capacity/
  10. http://www.greenenergyfutures.ca/blog/sunny-days-ahead-solar-alberta
  11. http://pv.nrcan.gc.ca/index.php?lang=e&m=r


Alberta Air Pollution Levels High in Sulphur and Nitrogen Reports Environment Canada

Environment Canada recently released images showing air emissions modelling results across Alberta. These images are a reminder of how a small number of large sources mix together to pollute the air Albertans breathe, resulting in increased risks to human health.

Sourced through Scoop.it from: www.pembina.org

“[…] SO2 and NOx emissions impact human health not only because they can cause direct harm, but also because they can react in the atmosphere to create fine particulate matter (PM2.5). The Alberta government has found that NOx and SO2 are the main causes of past incidents where PM2.5­ concentrations have exceeded Canada’s air quality standards.

PM2.5 can cause asthma attacks, hospitalizations and even premature death, as we’ve summarized before. It’s a particular concern in Alberta, where PM2.5 is putting us on track to have the worst air quality in Canada, and Edmonton’s pollution levels are exceeding Toronto’s.

These images underscore the cumulative impacts of a small number of very large industrial emissions sources — particularly coal plants, the oilsands and refineries — in addition to distributed industrial activities such as oil and gas operations. Those may all be separate sources, but their emissions end up in the same air. Pollutants from these different sources mix together in the air Albertans breathe, resulting in increased risks to human health. […]

Alberta is unique in the western half of North America for its mid- and high-level readings. The province more closely resembles the densely populated mid-Atlantic region of the United States, or the coal-burning Midwest, than our western neighbours.

Problem spots near coal plants, refineries and the oilsands

Another image shows how SO2 and NOX that is released into the atmosphere returns to ground level, or “deposits.” The image reveals a clear concentration (the orange and red spots) of the two pollutants being deposited around both Edmonton and the oilsands in northeast Alberta.

Edmonton is sandwiched between three large coal-burning power plants, which are clustered near Wabamun Lake west of Edmonton, and refineries on the east side of the city.

The video that AEMERA posted shows modelled SO2 plumes from large emitters across British Columbia, Alberta and Saskatchewan. The three-dimensional plumes reflect SO2 concentrations of at least three parts per billion. How the plumes travel was modelled using real weather conditions from a four-week period in the fall of 2013.

The video visually represents where SO2 is generated, how it moves through the atmosphere and where it eventually lands. As SO2 deposits on the ground, the land surface in the video changes colour to indicate where higher depositions are modelled. Although the specifics will differ for other pollutants, the video is representative of how airborne pollutants generally are dispersed and deposited.

It’s not particularly surprising to see that SO2 pollution originates from oil and gas production, coal plants and the oilsands — Alberta’s three largest-emitting sectors, by far. But seeing how much of the province is affected by these plumes may come as a shock.

The video shows that major industrial emissions do not blow in the direction of the prevailing wind pattern. Rather, they shift directions and can be combined with pollutants emitted in different areas. This raises concerns about environmental evaluations for new industrial emitters, since those evaluations focus on a much smaller area around the polluter — and focus on prevailing winds — rather than these dynamic wind patterns.

The data used for the oilsands is from 2010, so it discounts the emissions growth in that region over the last five years. The data for the rest of the sources is from 2006. In terms of coal emissions, these images correspond closely to today’s reality: NOx and SO2 in 2014 are at nearly the same levels as in 2006. […]”


See on Scoop.itGreen & Sustainable News

Solar Array Added to Power Agricultural District’s Irrigation Systems

Tranquillity Irrigation District, which serves the water needs of the 10,750-acre agricultural community of Tranquillity in Fresno County, today announces plans to build a 1.8 megawatt ground-mounted solar tracker system that will provide enough electricity to meet 50 percent of the agency’s energy demand. Borrego Solar Systems Inc., a leading designer, developer, installer and O&M …

Sourced through Scoop.it from: www.borregosolar.com

“[…] Tranquillity will save a net $10 million over the 25-year term of its power purchase agreement (PPA)—a financing mechanism that enables customers to invest in solar without any upfront costs. The District will buy the energy produced from the system owner at a set price over the PPA agreement term.

“Solar was clearly the best use for our site, especially considering the savings we’ll realize for our residents through the PPA – it’s truly a win-win,” said Danny Wade, general manager of Tranquillity Irrigation District. “The reality is that we will continue to be plagued with limited water resources for the foreseeable future, and solar is a sustainable solution to help us deal with the resulting energy demand and cost increase due to the drought. Any water district in the state should be investigating whether solar works for them.”

Given the ongoing drought in California, the District has needed to use its wells more than it had pre-drought. As a result, more electricity is needed to power the pumps bringing water toward the surface. The District is trying to provide water to its landowners and the community of Tranquillity as efficiently and economically as it can. For example, the District recently received a $5 million grant from the California State Department of Health to build a necessary water treatment facility. The solar tracker system will be placed adjacent to the treatment facility on land already owned by the District. […]

In its first year of operation, the array will generate an estimated 3.3 million kilowatt-hours of electricity— enough to power approximately 450 homes. The installation will offset more than 760 metric tons of CO2 equivalents annually, which is the equivalent of taking 162 cars off the road for a year or the amount of carbon sequestered by 630 acres of mature U.S. forests each year.

ABOUT TRANQUILLITY IRRIGATION DISTRICT

Tranquillity Irrigation District was formed January 22, 1918, as a public agency designed to serve the local community with water supplies. It is the second oldest such agency in Fresno County. A Board of Directors elected from the community at-large governs the District. The District is approximately 10,750 acres in size and is located in the west central portion of Fresno County in the Great Central Valley of California. The District farmland produces a variety of commodities including: cotton (pima and acala), canning tomatoes, alfalfa for seed, sugar beets and almonds. Its principal community is the unincorporated town of Tranquillity.  […]”

See on Scoop.itGreen Energy Technologies & Development

Massive Methane Gas Leak at California Storage Facility

The natural gas leak from a storage facility in the hills above Los Angeles is shaping up as a major ecological disaster as it vents large amounts of methane, a potent greenhouse gas.

Sourced through Scoop.it from: www.washingtonpost.com

” […]  A runaway natural gas leak from a storage facility in the hills above Los Angeles is shaping up as a significant ecological disaster, state officials and experts say, with more than 150 million pounds of methane pouring into the atmosphere so far and no immediate end in sight.

The rupture within a massive underground containment system — first detected more than two months ago — is venting gas at a rate of up to 110,000 pounds per hour, California officials confirm. The leak already has forced evacuations of nearby neighborhoods, and officials say pollutants released in the accident could have long-term consequences far beyond the region.

Newly obtained infrared video captures a plume of gas — invisible to the naked eye — spouting from a hilltop in the Aliso Canyon area above Burbank, like smoke billowing from a volcano. Besides being an explosive hazard, the methane being released is a powerful greenhouse gas, more potent than carbon dioxide in trapping heat in the lower atmosphere.

Scientists and environmental experts say the Aliso Canyon leak instantly became the biggest single source of methane emissions in all of California when it began two months ago. The impact of greenhouse gases released since then, measured over a 20-year time frame, is the equivalent of emissions from six coal-fired power plants or 7 million automobiles, environmentalists say. […]

See on Scoop.itGreen & Sustainable News

Increasing Heat Island Effect’s Influence on Urban Temperature Records Introduces Bias in Climate Studies

When it comes to human-caused climate change, urban warming is a big player.

Sourced through Scoop.it from: www.cato.org

>”Perhaps no other climatic variable receives more attention in the debate over CO2-induced global warming than temperature. Its forecast change over time in response to rising atmospheric CO2 concentrations is the typical measure by which climate models are compared. It is also the standard by which the climate model projections tend to be judged; right or wrong, the correctness of global warming theory is most often adjudicated by comparing model projections of temperature against real-world measurements. And in such comparisons, it is critical to have a proper baseline of good data; but that is easier acknowledged than accomplished, as multiple problems and potential inaccuracies have been identified in even the best of temperature data sets.

One particular issue in this regard is the urban heat island effect, a phenomenon by which urban structures artificially warm background air temperatures above what they normally would be in a non-urbanized environment. The urban influence on a given station’s temperature record can be quite profound. In large cities, for example, urban-induced heating can be as great as Tokyo’s 10°C, making it all the more difficult to detect and discern a CO2-induced global warming signal in the temperature record, especially since the putative warming of non-urbanized areas of the planet over the past century is believed to be less than 1°C.  Yet, because nearly all long-term temperature records have been obtained from sensors initially located in towns and cities that have experienced significant growth over the past century, it is extremely important that urbanization-induced warming – which can be a full order of magnitude greater than the background trend being sought – be removed from the original temperature records when attempting to accurately assess the true warming (or cooling!) of the natural non-urban environment. A new study by Founda et al. (2015) suggests this may not be so simple or straightforward a task.

Working with temperature records in and around the metropolitan area of Athens, Greece, Founda et al. set out to examine the interdecadal variability of the urban heat island (UHI) effect, since “few studies focus on the temporal variability of UHI intensity over long periods.” Yet, as they note, “knowledge of the temporal variability and trends of UHI intensity is very important in climate change studies, since [the] urban effect has an additive effect on long term air temperature trends.”

[…]

Such findings as these are of significant relevance in climate change studies, for they clearly indicate the UHI influence on a temperature record is not static. It changes over time and is likely inducing an ever-increasing warming bias on the temperature record, a bias that will only increase as the world’s population continues to urbanize in the years and decades ahead. Consequently, unless researchers routinely identify and remove this growing UHI influence from the various temperature data bases used in global change studies, there will likely be a progressive overestimation of the influence of the radiative effects of rising CO2 on the temperature record. “<

See on Scoop.itGreen & Sustainable News

Alberta Pipeline Spills 5 Million Liters in Major Leak Near Oil Sands

Nexen Energy apologized Friday for a major leak in an Alberta pipeline that was only installed last year and said a warning system failed to detect it.

Sourced through Scoop.it from: www.news1130.com

>” […] A contractor discovered the leak Wednesday about 35 kilometres southeast of Fort McMurray, Alta. Nexen shut down the pipeline soon after, but not before some five million litres of bitumen, produced water and sand spilled into muskeg.

Nexen, which was taken over by China’s CNOOC Ltd. in 2013, says the affected area is about 16,000 square metres, mostly along the pipeline’s route. […]

John Bennett, national program director of the Sierra Club Canada Foundation, said he was worried.

“We’re always concerned when petroleum products get spilled into the environment. There’s always damage, and it’s usually permanent of some nature,” said Bennett. “It’s full of toxic elements that should not be released into the environment.” “<

See on Scoop.itGreen & Sustainable News

Water Prices in 2015 Up 6 Percent in 30 Major U.S. Cities

Continuing a trend that reflects the disrepair and shows no sign of slowing, the price of residential water service in 30 major U.S. cities rose faster than the cost of nearly every other household staple last year …

Source: www.circleofblue.org

>” […] The economics of water — particularly the cost of treatment, pumping, and new infrastructure, as well as the retail price for consumers — gained renewed prominence as California and Texas, America’s two most populous states, face historic droughts and water managers seek to rein in water consumption, with price increases as one tool in their arsenal.

The average monthly cost of water for a family of four using 100 gallons per person per day climbed 6 percent, according to data collected from the utilities. It is the smallest year-to-year change in the six-year history of the Circle of Blue survey but comparable to past years. The median increase this year was 4.5 percent. In comparison, the Consumer Price Index rose just 1.8 percent in the 12 months ending in March, not including the volatile food and energy sectors. Including food and energy, prices fell by 0.1 percent.

For families using 150 gallons and 50 gallons per person per day, average water prices rose 6 percent and 5.2 percent, respectively.

The survey results reflect broad trends in the municipal water industry that nearly every U.S. utility must grapple with, according to Andrew Ward, a director of U.S. public finance for Fitch Ratings, a credit agency.

Distribution pipes, which can branch for thousands of miles beneath a single city, have aged beyond their shelf life and crack open daily. Some assessments peg the national cost of repairing and replacing old pipes at more than $US 1 trillion over the next two decades. In addition, new treatment technologies are needed to meet Safe Drinking Water Act and Clean Water Act requirements, and cities must continue to pay down existing debts. At the same time, conservation measures have proven successful. Utilities are selling less water, but they still need big chunks of revenue to cover the substantial cost of building and maintaining a water system. All together, these and other factors amount to a persistent upward pressure on water rates. […]

See on Scoop.itGreen & Sustainable News

CloudSolar Helps Renewable Energy Fans Who Can’t Install Their Own Solar Panels

The 50 Year Underground Coal Mine Fire

By the early 1980s, the mine fire in Centralia, Pennsylvania was growing worse and increasingly threatening the people who lived there. GAI, Inc., a private geotechnical engineering company, was hired to review the situation and propose a solution to finally contain the fire. What they eventually came up with was so drastic, it might easily have been called Centralia’s “Nuclear Option.”

Source: www.centraliapa.org

Additional Information:  Zip Code 00000 (Washington Post) http://wapo.st/1eMhdGq

>” […]

GAI’s review and associated containment plan took months to complete. It analyzed mountains of data about Centralia PA, its abandoned mines, and the geology of the surrounding area. GAI also explored the beginnings of the fire, the current location of the burn, and the previous, failed attempts to stop it.

Finally on July 12, 1983 the findings were announced to the public. At that time, the mine fire was determined to be under 195 acres and burning in the Skidmore, Seven Foot, and Buck Leader coal veins. It was suggested that the fire could eventually grow to a maximum size of 3,700 acres of land.

GAI’s report made it clear that containing the Centralia mine fire would neither be easy nor cheap. The plan to contain the fire would require excavating a trench of massive proportions. This would need to be 3,700 feet long and 450 feet in depth – deep enough to hold a 45 story office building!

Worse yet, the trench would cut through the middle of the town. Although it would eventually be filled in with incombustible material to prevent the mine fire from moving further west, half of the borough of Centralia Pennsylvania would be destroyed while excavating it. The whole project would take years to complete.

If the damage caused by GAI’s plan wasn’t “nuclear” enough, there was always the price tag. GAI estimated it would cost a jaw-dropping $660 million to complete the project. This was over 100 times more expensive than the 1965 rejected plan to contain the mine fire. According to the Bureau of Labor and Statistics, $660 million in 1983 is roughly equivalent to $1.5 billion in 2015. Today these cost estimates are still shocking.

It is no wonder that in August of 1983 the majority of Centralia PA’s residents voted to be relocated. After years of struggling with the mine fire, the “nuclear option” proposed by GAI to stop the fire and level half of the town was more than most could bear.”<


See on Scoop.itGreen & Sustainable News